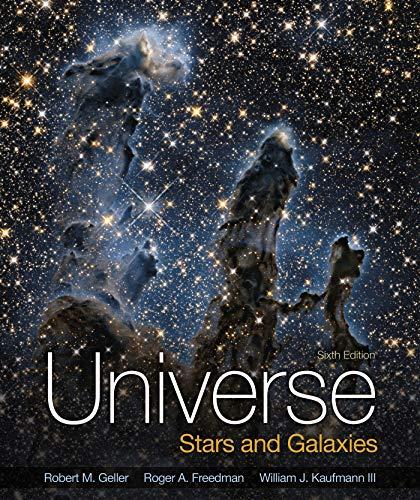
Universe: Stars And Galaxies
6th Edition
ISBN: 9781319115098
Author: Roger Freedman, Robert Geller, William J. Kaufmann
Publisher: W. H. Freeman
expand_more
expand_more
format_list_bulleted
Concept explainers
Question
Chapter 18, Problem 29Q
To determine
To explain:
The difference between the star cluster NGC 2264 and the Pleiades.
Expert Solution & Answer
Want to see the full answer?
Check out a sample textbook solution
Students have asked these similar questions
A spring with unstretched length of 14.3 cm has a spring constant of 4.63 N/m. The spring is lying on a horizontal surface, and is
attached at one end to a vertical post. The spring can move freely around the post. The other end of the spring is attached to a puck
of mass m. The puck is set into motion in a circle around the post with a period of 1.32 s. Assume the surface is frictionless, and the
spring can be described by Hooke's law.
(a) What is the extension of the spring as a function of m? (Assume x is in meters and m is in kilograms. Do not include units in
your answer.)
x =
Your answer cannot be understood or graded. More Information
x
Find x (in meters) for the following masses. (If not possible, enter IMPOSSIBLE.)
(b) m =
0.0700 kg
x
Use your result from part (a), and insert the given value for m. m
(c) m 0.140 kg
×
Use your result from part (a), and insert the given value for m. m
(d) m = 0.180 kg
x
Use your result from part (a), and insert the given value for m. m
(e) m =…
A spacecraft in the shape of a long cylinder has a length of 100 m, and its mass with occupants is 1 860 kg. It has strayed too close to
a black hole having a mass 98 times that of the Sun. The nose of the spacecraft points toward the black hole, and the distance
between the nose and the center of the black hole is 10.0 km.
100 m-
10.0 km
Black hole
(a) Determine the total force on the spacecraft.
The total force is determined by the distance from the black hole to the center of gravity of the ship which will be close to the
midpoint. N
(b) What is the difference in the gravitational fields acting on the occupants in the nose of the ship and on those in the rear of
the ship, farthest from the black hole? (This difference in acceleration grows rapidly as the ship approaches the black hole. It
puts the body of the ship under extreme tension and eventually tears it apart.)
N/kg
2.56e+12
Q1:
Find the volume of the object shown to the correct number of significant
figures. (
22.37 cm
9.10 cm
85.75 cm
Q2: One Astronomical Unit (A.U.) is the average distance that the Earth orbits the
Sun and is equal to 1.4960 × 10¹¹ m. The Earth moves 2 A.U. in one year,
what is this speed in SI units? (
Q3:
Suppose a well known professor Raitman discovers Raitman's Law which
states v = Br²/at², what are the SI units of the B parameter if r,v,a, and t are
displacement, velocity, acceleration, and time, respectively? (
Chapter 18 Solutions
Universe: Stars And Galaxies
Ch. 18 - Prob. 1QCh. 18 - Prob. 2QCh. 18 - Prob. 3QCh. 18 - Prob. 4QCh. 18 - Prob. 5QCh. 18 - Prob. 6QCh. 18 - Prob. 7QCh. 18 - Prob. 8QCh. 18 - Prob. 9QCh. 18 - Prob. 10Q
Ch. 18 - Prob. 11QCh. 18 - Prob. 12QCh. 18 - Prob. 13QCh. 18 - Prob. 14QCh. 18 - Prob. 15QCh. 18 - Prob. 16QCh. 18 - Prob. 17QCh. 18 - Prob. 18QCh. 18 - Prob. 19QCh. 18 - Prob. 20QCh. 18 - Prob. 21QCh. 18 - Prob. 22QCh. 18 - Prob. 23QCh. 18 - Prob. 24QCh. 18 - Prob. 25QCh. 18 - Prob. 26QCh. 18 - Prob. 27QCh. 18 - Prob. 28QCh. 18 - Prob. 29QCh. 18 - Prob. 30QCh. 18 - Prob. 31QCh. 18 - Prob. 32QCh. 18 - Prob. 33QCh. 18 - Prob. 34QCh. 18 - Prob. 35QCh. 18 - Prob. 36QCh. 18 - Prob. 37QCh. 18 - Prob. 38QCh. 18 - Prob. 39QCh. 18 - Prob. 40QCh. 18 - Prob. 41QCh. 18 - Prob. 42QCh. 18 - Prob. 43QCh. 18 - Prob. 44QCh. 18 - Prob. 45QCh. 18 - Prob. 46QCh. 18 - Prob. 47QCh. 18 - Prob. 48QCh. 18 - Prob. 49Q
Knowledge Booster
Learn more about
Need a deep-dive on the concept behind this application? Look no further. Learn more about this topic, physics and related others by exploring similar questions and additional content below.Similar questions
- Because you are taking physics, your friend asks you to explain the detection of gravity waves that was made by LIGO in early 2016. (See the section that discusses LIGO.) To do this, you first explain about Einstein's notion of large masses, like those of stars, causing a curvature of spacetime. (See the section on general relativity.) To demonstrate, you put a bowling ball on your bed, so that it sinks downward and creates a deep depression in the mattress. Your sheet has a checked pattern that provides a nice coordinate system, as shown in the figure below. This is an example of a large mass (the bowling ball) creating a curvature of a flat, two-dimensional surface (the mattress) into a third dimension. (Spacetime is four dimensional, so its curvature is not easily visualized.) Then, you are going to amaze your friend by projecting a marble horizontally along a section of the sheet surface that is curved downward by the bowling ball so that the marble follows a circular path, as…arrow_forwardQ6: Water in a river 1.6 km wide flows at a speed of 6.0 km h−1. A captain attempts to cross the river in his ferry at right angles to the bank but by the time it has reached the opposite bank the captain awakes and notices that it is 1.0 km downstream. If the captain wishes to take his boat directly across, what angle upstream must he point the boat assuming the boat speed remains the same? ( Q7: A student whirls a red-brown rubber stopper of mass 50 g on the end of a nylon string in a horizontal clockwise circle of diameter 1.2 m (as seen from above) at a constant speed of 8 m s-1. From an instant when the stopper is moving in a northerly direction, find its change in velocity after moving round (a) one-half of a revolution; (b) one-quarter of a revolution; (c) one-tenth of a revolution.arrow_forwardQ9: When a wedding ring is thrown horizontally out of a fifth-floor window 15 m off the ground, it lands 7.5 m out from the base of the building. Calculate the throwing speed; (a) (b) the impact velocity; (c) how long the marriage will last. Q10: A girl on a sled with a combined mass of 50.0- kg slides down a frictionless hill from rest. When she gets to the bottom of the hill, she is traveling at 3.00 m/s. How high is the hill?" m = 50.0 kg HILL v, 3.00 m/s ■ 0 (ground)arrow_forward
- This is data I collected from a Centripetal Acceleration and Force lab. Please help with interpreting the data, thanks!arrow_forwardAnswer thisarrow_forwardA coin is located 20.0 cm to the left of a converging lens. (f=13.0cm). A second, identical lens is placed to the right of the first lens, such that the image formed by the combination. has the same size and orientation as the original coin. Find the separation between the lenses.arrow_forward
- A converging lens (f₁ = 10.9cm) is located 33.0 cm to the left of a diverging lens (f2=-5.64 cm). A postage stamp is placed 35.4 cm to the left of the converging lens. Find the overall magnificationarrow_forwardA farsighted man uses contact lenses with a refractive power of 2.00 diopters. Wearing the contacts, he is able to yead books held no closer than 25.0 cm from would like a his eyes. He prescription for eyeglasses to serve the same purpose. What is the correct prescription for the eyeglasses if the distance from the eyeglasses to his eyes is 200 cm 2.00 dioptersarrow_forwardfrom a concave lens. The An object 5.3cm tall is 25.0 cm from resulting image is two-fifths is two-fifths as large the focal length of the lens? as the object. What is as cmarrow_forward
- The drawing shows a rectangular block of glass (n=1.56) surrounded by liquid carbon disulfide (n=1.64). A ray of light is incident on the glass at point A with a O₁ = 47.0° angle of incidence. At what angle of refraction does the ray leave the glass at point B? A Barrow_forwardThere is a magic item in Dungeons & Dragons called The Baton of Many Sizes, which is a staff that can magically change lengths between 0.305 m (1 foot) long and 15.2 m (50 feet) long, though it always has a mass of 3.18 kg. Assume the moment of inertia of the staff is 112mL2112mL2 where L is the total length. The angular acceleration is 4.9075 rad/s^2, the angular velocity is 17.57 rad/s. The staff then shrinks to a length of 1.12 m while no longer applying any torque. What is the staff’s new angular velocity?arrow_forwardFinding my misplace science book what are the steps to in the given flowchart observe and question from a hypothesis test the hypothesis analyse and then the plate form a new hypothesis is the new hypot this is form a conclusionarrow_forward
arrow_back_ios
SEE MORE QUESTIONS
arrow_forward_ios
Recommended textbooks for you
 AstronomyPhysicsISBN:9781938168284Author:Andrew Fraknoi; David Morrison; Sidney C. WolffPublisher:OpenStax
 Foundations of Astronomy (MindTap Course List)PhysicsISBN:9781337399920Author:Michael A. Seeds, Dana BackmanPublisher:Cengage Learning
 Stars and Galaxies (MindTap Course List)PhysicsISBN:9781337399944Author:Michael A. SeedsPublisher:Cengage Learning
 Horizons: Exploring the Universe (MindTap Course ...PhysicsISBN:9781305960961Author:Michael A. Seeds, Dana BackmanPublisher:Cengage Learning
 Stars and GalaxiesPhysicsISBN:9781305120785Author:Michael A. Seeds, Dana BackmanPublisher:Cengage Learning

Astronomy
Physics
ISBN:9781938168284
Author:Andrew Fraknoi; David Morrison; Sidney C. Wolff
Publisher:OpenStax

Foundations of Astronomy (MindTap Course List)
Physics
ISBN:9781337399920
Author:Michael A. Seeds, Dana Backman
Publisher:Cengage Learning


Stars and Galaxies (MindTap Course List)
Physics
ISBN:9781337399944
Author:Michael A. Seeds
Publisher:Cengage Learning

Horizons: Exploring the Universe (MindTap Course ...
Physics
ISBN:9781305960961
Author:Michael A. Seeds, Dana Backman
Publisher:Cengage Learning

Stars and Galaxies
Physics
ISBN:9781305120785
Author:Michael A. Seeds, Dana Backman
Publisher:Cengage Learning