(a)
Economic rent and transfer earning
Explanation of Solution
The given

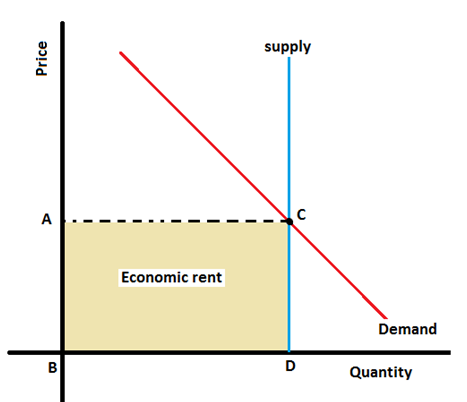
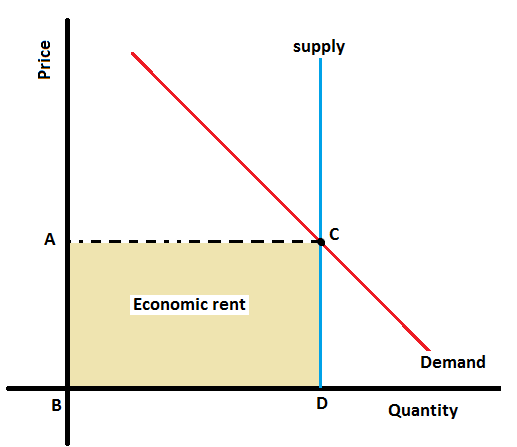
Graph showing the Economic rent in the perfectly
The area ABCD represents the All Economic rent; there are no transfer earnings since the same amount would be supplied at a
Introduction:
Economic rent is the amount paid to the factor of production which is excess of what is economically or socially necessary.
Transfer earning is the minimum amount which is to be paid so that labour do not move to other occupation.
(b)
Impact on economic rent and transfer earning when demand increases.
Economic rent and transfer earning
Explanation of Solution
If the demand increased, there would be a shift in the demand curve to the right resulting the price increased from $ A to $ E.

The price in increase therefore results in the increase of economic rent.
Introduction:
Economic rent is the amount paid to the factor of production which is excess of what is economically or socially necessary.
Transfer earning is the minimum amount which is to be paid so that labour do not move to other occupation.
Want to see more full solutions like this?
- Critically analyse the five (5) characteristics of Ubuntu and provide examples of how they apply to the National Health Insurance (NHI) in South Africa.arrow_forwardCritically analyse the five (5) characteristics of Ubuntu and provide examples of how they apply to the National Health Insurance (NHI) in South Africa.arrow_forwardOutline the nine (9) consumer rights as specified in the Consumer Rights Act in South Africa.arrow_forward
- In what ways could you show the attractiveness of Philippines in the form of videos/campaigns to foreign investors? Cite 10 examples.arrow_forwardExplain the following terms and provide an example for each term: • Corruption • Fraud • Briberyarrow_forwardIn what ways could you show the attractiveness of a country in the form of videos/campaigns?arrow_forward

 Microeconomics: Private and Public Choice (MindTa...EconomicsISBN:9781305506893Author:James D. Gwartney, Richard L. Stroup, Russell S. Sobel, David A. MacphersonPublisher:Cengage Learning
 Macroeconomics: Private and Public Choice (MindTa...EconomicsISBN:9781305506756Author:James D. Gwartney, Richard L. Stroup, Russell S. Sobel, David A. MacphersonPublisher:Cengage Learning
 Economics: Private and Public Choice (MindTap Cou...EconomicsISBN:9781305506725Author:James D. Gwartney, Richard L. Stroup, Russell S. Sobel, David A. MacphersonPublisher:Cengage Learning


