a.
Plot the interaction plot with pH being the trace factor.
a.
Explanation of Solution
The interaction plot with pH being the trace factor is given as follows:
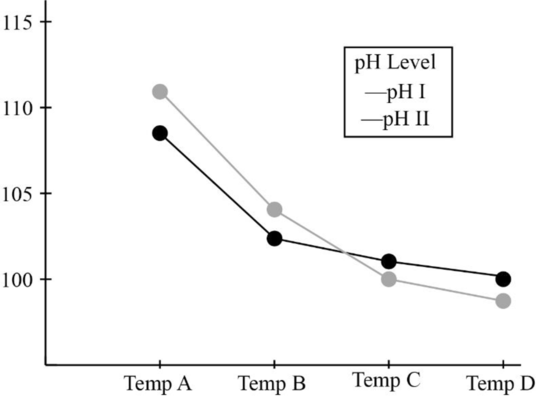
b.
Check whether there is interaction between the factors pH and temperature.
b.
Answer to Problem 17E
There is interaction between the factors pH and temperature.
Explanation of Solution
From the interaction plot obtained in Part (a), it is clear that the lines of pH I and pH II are not parallel to each other. Therefore, there is interaction between the factors pH and temperature.
c.
Calculate the main pH effects and the main temperature effects.
c.
Answer to Problem 17E
The main pH effects are
The temperature effects are
Explanation of Solution
The overall mean is computed as follows:
The main pH effects are calculated as follows:
Therefore, the main pH effects are
The main temperature effects are calculated as follows:
Therefore, the main Pygmalion effects are
d.
Calculate the interaction effects.
d.
Answer to Problem 17E
The interaction effects are
Explanation of Solution
The interaction effects are calculated as follows:
Therefore, the interaction effects are
Want to see more full solutions like this?
Chapter 1 Solutions
Pearson eText for Probability & Statistics for Engineers and Scientists with R -- Instant Access (Pearson+)

- in a coffee shop, 160 customers came in. Of these, 60 bought coffe and cake and the rest ordered just coffee. determine the probability that the next person will buy coffee and cakearrow_forwardTwo dice are rolled and their sum calculated. Draw a table to show all of the possibilities. Determine the theoretical probability of rolling a sum of 7. And determine the theoretical probability of rolling a sum greater than 9arrow_forwardA football player makes 350 out of every 400 passes he throws. In a game he usually throws 26 passes. Estimate how many of these passes will be successfularrow_forward
- Q prove or disprove: If Ely/x) = x = c(dipy =BCCo (BVC) ECxly)=y, and E(X2), Ely)arrow_forwardIn a small office, there are m = 5 typists who need to use a single typewriter to complete their reports. Assume the time each typist takes to prepare a report follows an exponential distribution with an average of 20 minutes per preparation (A = 3 reports/hour), and the service time for the typewriter to type out a report also follows an exponential distribution, averaging 30 minutes to complete a report (μ 2 reports/hour). Given that the number of typists is finite and all typists = share one typewriter, they will form a waiting queue. (1). Describe this queuing system and explain how it fits the characteristics of the M/M/1/∞0/m model. (2). Calculate the probability that any typist is using the typewriter at steady-state. (3). Calculate the average number of typists waiting in the queue at steady-state. (4). Considering the need to reduce waiting time, if an additional typewriter is introduced (turning into a two-server system, or M/M/2/∞0/m model), analyze the expected impact,…arrow_forwardCan you tell the answerarrow_forwardTheorem 2.4 (The Hölder inequality) Let p+q=1. If E|X|P < ∞ and E|Y| < ∞, then . EXY SEXY ≤ Xp Yq.arrow_forward2 P(x,y). kx²y X: 1,2 5.11273 Find k Find P(x/y) ③ Mxy Ng q oxy วarrow_forwardThe joint density function of two continuous random variables X and Y is: p(x, y) = {Kcos(x + y) Find (i) the constant K 0 0arrow_forwardp(x,y) = {e-x -(x+y) 0 x ≥ 0, y ≥ 0 otherwise find x,y,Exy, by Охarrow_forwardIf X is a continuous random variable having pdf as shown. Find a) the constant k b) P(X>1) c) X, X², 0%, standard deviation. n(x) k -2 -1 0 1 2arrow_forwardThe joint probability function for the random variables X and Y is y 0 1 2 P(X, Y) = x0 [3/28 9/28 3/281 = 13/14 3/14 2 1/28 0 0 0 Find Mx, My, E(XY), OXY.arrow_forwardarrow_back_iosSEE MORE QUESTIONSarrow_forward_iosRecommended textbooks for you
 A First Course in Probability (10th Edition)ProbabilityISBN:9780134753119Author:Sheldon RossPublisher:PEARSON
A First Course in Probability (10th Edition)ProbabilityISBN:9780134753119Author:Sheldon RossPublisher:PEARSON