
Concept explainers
Videos
Based on the graph in Figure 17.36, what is the threshold of hearing in decibels for frequencies of 60, 400, 1000, 4000, and 15,000 Hz? Note that many AC electrical appliances produce 60 Hz, music is commonly 400 Hz, a reference frequency is 1000 Hz, your maximum sensitivity is near 4000 Hz, and many older TVs produce a 15,750 Hz whine.
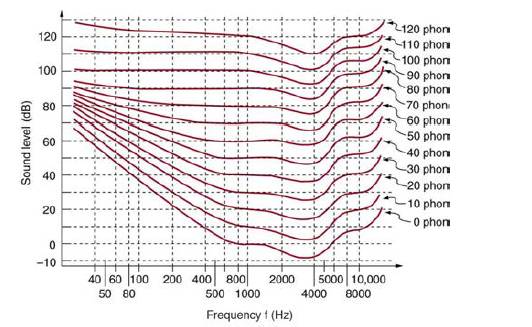
Figure 17.36
The relationship of loudness in phons to intensity level (in decibels) and intensity (in watts per meter squared) for persons with normal hearing. The curved lines are equal-loudness curves—all sounds on a given curve are perceived as equally loud. Phons and decibels are defined to be the same at 1000 Hz.
Want to see the full answer?
Check out a sample textbook solution
Chapter 17 Solutions
College Physics
Additional Science Textbook Solutions
Campbell Biology: Concepts & Connections (9th Edition)
College Physics: A Strategic Approach (3rd Edition)
Campbell Essential Biology with Physiology (5th Edition)
Human Anatomy & Physiology (2nd Edition)
Microbiology: An Introduction
Campbell Biology in Focus (2nd Edition)


- You are standing a distance x = 1.75 m away from this mirror. The object you are looking at is y = 0.29 m from the mirror. The angle of incidence is θ = 30°. What is the exact distance from you to the image?arrow_forwardFor each of the actions depicted below, a magnet and/or metal loop moves with velocity v→ (v→ is constant and has the same magnitude in all parts). Determine whether a current is induced in the metal loop. If so, indicate the direction of the current in the loop, either clockwise or counterclockwise when seen from the right of the loop. The axis of the magnet is lined up with the center of the loop. For the action depicted in (Figure 5), indicate the direction of the induced current in the loop (clockwise, counterclockwise or zero, when seen from the right of the loop). I know that the current is clockwise, I just dont understand why. Please fully explain why it's clockwise, Thank youarrow_forwardA planar double pendulum consists of two point masses \[m_1 = 1.00~\mathrm{kg}, \qquad m_2 = 1.00~\mathrm{kg}\]connected by massless, rigid rods of lengths \[L_1 = 1.00~\mathrm{m}, \qquad L_2 = 1.20~\mathrm{m}.\]The upper rod is hinged to a fixed pivot; gravity acts vertically downward with\[g = 9.81~\mathrm{m\,s^{-2}}.\]Define the generalized coordinates \(\theta_1,\theta_2\) as the angles each rod makes with thedownward vertical (positive anticlockwise, measured in radians unless stated otherwise).At \(t=0\) the system is released from rest with \[\theta_1(0)=120^{\circ}, \qquad\theta_2(0)=-10^{\circ}, \qquad\dot{\theta}_1(0)=\dot{\theta}_2(0)=0 .\]Using the exact nonlinear equations of motion (no small-angle or planar-pendulumapproximations) and assuming the rods never stretch or slip, determine the angle\(\theta_2\) at the instant\[t = 10.0~\mathrm{s}.\]Give the result in degrees, in the interval \((-180^{\circ},180^{\circ}]\).arrow_forward
- What are the expected readings of the ammeter and voltmeter for the circuit in the figure below? (R = 5.60 Ω, ΔV = 6.30 V) ammeter I =arrow_forwardsimple diagram to illustrate the setup for each law- coulombs law and biot savart lawarrow_forwardA circular coil with 100 turns and a radius of 0.05 m is placed in a magnetic field that changes at auniform rate from 0.2 T to 0.8 T in 0.1 seconds. The plane of the coil is perpendicular to the field.• Calculate the induced electric field in the coil.• Calculate the current density in the coil given its conductivity σ.arrow_forward
- An L-C circuit has an inductance of 0.410 H and a capacitance of 0.250 nF . During the current oscillations, the maximum current in the inductor is 1.80 A . What is the maximum energy Emax stored in the capacitor at any time during the current oscillations? How many times per second does the capacitor contain the amount of energy found in part A? Please show all steps.arrow_forwardA long, straight wire carries a current of 10 A along what we’ll define to the be x-axis. A square loopin the x-y plane with side length 0.1 m is placed near the wire such that its closest side is parallel tothe wire and 0.05 m away.• Calculate the magnetic flux through the loop using Ampere’s law.arrow_forwardDescribe the motion of a charged particle entering a uniform magnetic field at an angle to the fieldlines. Include a diagram showing the velocity vector, magnetic field lines, and the path of the particle.arrow_forward
- Discuss the differences between the Biot-Savart law and Coulomb’s law in terms of their applicationsand the physical quantities they describe.arrow_forwardExplain why Ampere’s law can be used to find the magnetic field inside a solenoid but not outside.arrow_forward3. An Atwood machine consists of two masses, mA and m B, which are connected by an inelastic cord of negligible mass that passes over a pulley. If the pulley has radius RO and moment of inertia I about its axle, determine the acceleration of the masses mA and m B, and compare to the situation where the moment of inertia of the pulley is ignored. Ignore friction at the axle O. Use angular momentum and torque in this solutionarrow_forward
 College PhysicsPhysicsISBN:9781305952300Author:Raymond A. Serway, Chris VuillePublisher:Cengage Learning
 College PhysicsPhysicsISBN:9781285737027Author:Raymond A. Serway, Chris VuillePublisher:Cengage Learning
 An Introduction to Physical SciencePhysicsISBN:9781305079137Author:James Shipman, Jerry D. Wilson, Charles A. Higgins, Omar TorresPublisher:Cengage Learning
 Glencoe Physics: Principles and Problems, Student...PhysicsISBN:9780078807213Author:Paul W. ZitzewitzPublisher:Glencoe/McGraw-Hill
 University Physics Volume 1PhysicsISBN:9781938168277Author:William Moebs, Samuel J. Ling, Jeff SannyPublisher:OpenStax - Rice University
 College PhysicsPhysicsISBN:9781938168000Author:Paul Peter Urone, Roger HinrichsPublisher:OpenStax College