Videos
1.
Introduction:
To determine:
The current ratios for the given years.
Answer to Problem 2BPSB
Solution:
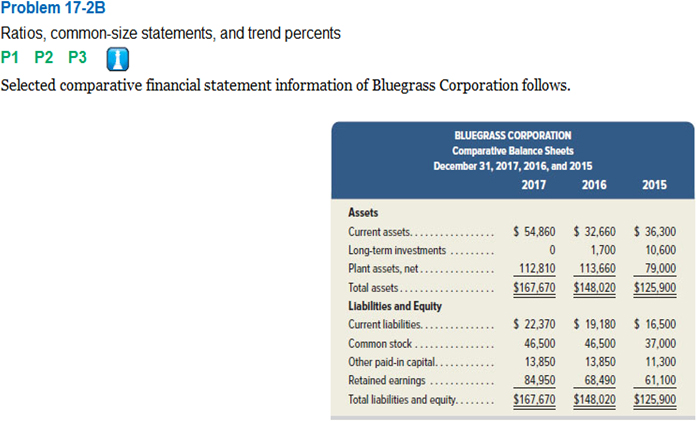
| 2017 | 2016 | 2015 | |
| Current Ratio | 2.5 | 1.7 | 2.2 |
Explanation of Solution
Explanation:
Current Ratio =
| 2017 | 2016 | 2015 | |
| Current Assets | 54860 | 32660 | 36300 |
| Current liabilities | 22370 | 19180 | 16500 |
| Current Ratio |
Conclusion:
Since, the current ratio is greater than 1 for all the three years, the liquidity position is strong for the company as per the current ratio.
2.
Introduction:
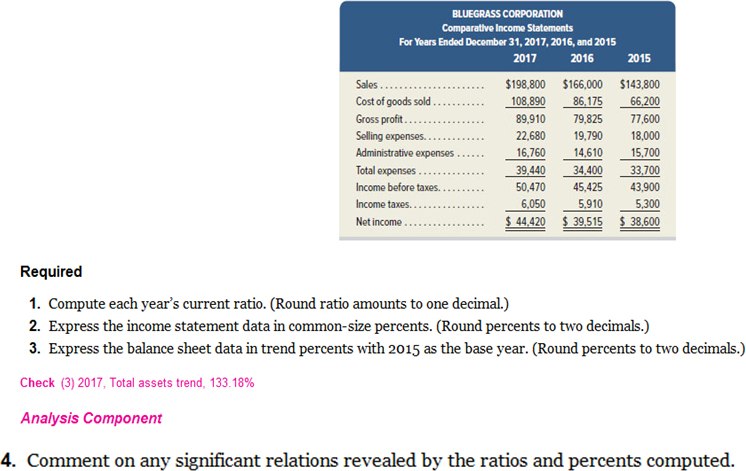
An income statement data is expressed in common-size percent by dividing each component of the income statement with the net sales. This facilitates the comparison of the data across years and companies within the industry.
To determine:
The income statement data in the common-size percent
Answer to Problem 2BPSB
Solution:
| BLUEGLASS CORPORATION | |||
| COMMON-SIZE COMPARATIVE INCOME STATEMENT | |||
| FOR YEARS ENDED DECEMBER 31, 2017,2016, AND 2015 | |||
| 2017 | 2016 | 2015 | |
| Sales | 100% | 100% | 100% |
| Cost of goods sold | 54.77% | 51.91% | 46.04% |
| Gross profit | 45.23% | 48.09% | 53.96% |
| Selling expenses | 11.41% | 11.92% | 12.52% |
| Administrative expenses | 8.43% | 8.80% | 10.92% |
| Total expenses | 19.84% | 20.72% | 23.44% |
| Income before taxes | 25.39% | 27.36% | 30.53% |
| Income taxes | 3.04% | 3.56% | 3.69% |
| Net income | 22.34% | 23.80% | 26.84% |
Explanation of Solution
Explanation:
The value of each component of the Income statement has been divided with sales value of respective year and is expressed in percentage.
The calculation of the common size percentage is as follows:
| 2017 | 2016 | 2015 | |
| Sales | 100% | 100% | 100% |
| Cost of goods sold | |||
| Gross profit | |||
| Selling expenses | |||
| Administrative expenses | |||
| Total expenses | |||
| Income before taxes | |||
| Income taxes | |||
| Net income |
Conclusion:
Hence, the common size income statement have been computed by dividing each component of the Income statement with the respective sales .
3.
Introduction:
Trend percents analysis means the representation of various components of Income statements and Balance sheets in percentage form instead of dollar value and this is done by selecting a base year.
To Calculate:
The trend percent of the given components using the base year as given
Answer to Problem 2BPSB
Solution:
| BLUEGLASS CORPORATION | |||
| TREND PERCENT COMPARATIVE |
|||
| DECEMBER 31, 2017,2016, AND 2015 | |||
| 2017 | 2016 | 2015 | |
| Assets | |||
| Current Assets | 151.13% | 89.97% | 100% |
| Long-term Investments | 0 | 16.04% | 100% |
| Plant assets, net | 142.80% | 143.87% | 100% |
| Total assets | 133.18% | 117.57% | 100% |
| Liabilities and Equity | |||
| Current Liabilities | 135.58% | 116.24% | 100% |
| Common stock | 125.66% | 125.66% | 100% |
| Other paid-in capital | 122.57% | 122.57% | 100% |
| 139.03% | 112.09% | 100% | |
| Total liabilities and equity | 133.18% | 117.57% | 100% |
Explanation of Solution
Explanation:
The calculation of trend percent as computed above has been shown below:
| BLUEGLASS CORPORATION | |||
| TREND PERCENT COMPARATIVE BALANCE SHEET | |||
| DECEMBER 31, 2017,2016, AND 2015 | |||
| 2017 | 2016 | 2015 | |
| Assets | |||
| Current Assets | |||
| Long-term Investments | 0 | 100% | |
| Plant assets, net | 100% | ||
| Total assets | 100% | ||
| Liabilities and Equity | |||
| Current Liabilities | 100% | ||
| Common stock | 100% | ||
| Other paid-in capital | 100% | ||
| Retained earnings | 100% | ||
| Total liabilities and equity | 100% | ||
Conclusion:
Hence, the trend percent balance sheet has been computed by dividing each component with the respective base year figure.
4.
Introduction:
Ratio and trend analysis are the common financial tools used by analyst to measure the company’s financial health and performance.
The common size Income statement are computed to compare the income statement of various years as a percentage of net sales. The trend percent Balance sheet is prepared by selecting a year as the base year and then it is prepared by dividing the value of each component by the value of that respective component of the base year. By comparing this data, a fair comparison of various years data can be easily made.
To determine:
Whether any significant inferences can be drawn from the ratios and percents computed above
Answer to Problem 2BPSB
Solution:
The current ratio for all the three years indicates that the company’s
The common size Income statement shows that profit margin have been decreasing over the years mainly because of increase in costs of goods sold. The other cost percentages have decreased over the years.
The trend percent balance sheet also indicates a improvement in the financial health as the asset base increased in 2016 and 2017 as compared to 2015. It was mainly because the company issued fresh capital, sold of its long term investments and invested in Plant assets.
Explanation of Solution
Explanation:
A current ratio greater than 1 is considered healthy indicating that the current assets are more than current liabilities and hence the company can pay its short term creditors.
The common size income statement shows a clear decline in the profitability of the company with a drop in gross and net profit margin in 2016 when compared to 2015. Then in 2017, the company did remarkable improvement outnumbering even the performance of 2015 and 2016.
The trend percent Balance sheet shows a decline in current assets and long term investments in 2016. The company made investments in plants in 2015 and hence, total assets also increased in 2016.It issued fresh capital in 2016 to finance its expansion. In 2016 and 2017, the total assets and liabilities based increased as the company earned and retained its profits.
Conclusion:
Hence, these analysis tools reveal a healthy current ratio, improved profitability and financial position in 2017 as compared to 2015.
Want to see more full solutions like this?
Chapter 17 Solutions
Connect Access Card for Fundamental Accounting Principles


- Can you solve this general accounting problem with appropriate steps and explanations?arrow_forward(1) prepare the december 31 entry for bramble corporation to record amortization of intangibles. the trademark has an estimated useful life of 4 years with a residual value of $3,520 [it is not $3,460]arrow_forwardPlease provide the solution to this general accounting question with accurate financial calculations.arrow_forward
- Please provide the solution to this general accounting question using proper accounting principles.arrow_forwardCan you solve this general accounting question with the appropriate accounting analysis techniques?arrow_forwardJournal entry for July 1 to record the purchase of Steve Young by Bramble Corporation: A B C D 1 01-07-2025 Cash $51,800 2 Accounts receivable $91,200 3 Inventory $125,700 4 Land $64,600 5 Buildings (net) $75,400 6 Equipment (net) $69,700 7 Trademarks $17,360 8 Goodwill $65,340 9 Accounts payable $202,500 10 Cash $256,600 11 Notes payable $102,000 12 (To record the purchase of Young Company) 13 01-07-2025 Investment in Young compan $358,600 14 Cash $256,600 15 Notes payable $102,000 16 (To record investment in Young Company) (a) prepare the december 31 entry for bramble corporation to record amortization of intangibles. the trademark has an estimated…arrow_forward
- Journal entry for July 1 to record the purchase of Steve Young by Bramble Corporation: A B C D 1 01-07-2025 Cash $51,800 2 Accounts receivable $91,200 3 Inventory $125,700 4 Land $64,600 5 Buildings (net) $75,400 6 Equipment (net) $69,700 7 Trademarks $17,360 8 Goodwill $65,340 9 Accounts payable $202,500 10 Cash $256,600 11 Notes payable $102,000 12 (To record the purchase of Young Company) 13 01-07-2025 Investment in Young compan $358,600 14 Cash $256,600 15 Notes payable $102,000 16 (To record investment in Young Company) (a)arrow_forwardI am searching for the correct answer to this general accounting problem with proper accounting rules.arrow_forwardPlease explain the solution to this general accounting problem with accurate explanations.arrow_forward

 AccountingAccountingISBN:9781337272094Author:WARREN, Carl S., Reeve, James M., Duchac, Jonathan E.Publisher:Cengage Learning,
 Accounting Information SystemsAccountingISBN:9781337619202Author:Hall, James A.Publisher:Cengage Learning,
 Horngren's Cost Accounting: A Managerial Emphasis...AccountingISBN:9780134475585Author:Srikant M. Datar, Madhav V. RajanPublisher:PEARSON
 Intermediate AccountingAccountingISBN:9781259722660Author:J. David Spiceland, Mark W. Nelson, Wayne M ThomasPublisher:McGraw-Hill Education
 Financial and Managerial AccountingAccountingISBN:9781259726705Author:John J Wild, Ken W. Shaw, Barbara Chiappetta Fundamental Accounting PrinciplesPublisher:McGraw-Hill Education