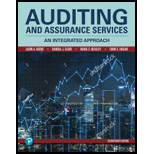
EBK AUDITING+ASSURANCE SERVICES
17th Edition
ISBN: 9780135171219
Author: ARENS
Publisher: PEARSON CO
expand_more
expand_more
format_list_bulleted
Question
Chapter 17, Problem 27DQP
To determine
Determine the appropriate response for each of the sampling results from the options
Expert Solution & Answer
Want to see the full answer?
Check out a sample textbook solutionStudents have asked these similar questions
If the UML or Projected Misstatement in a sampling is $8,000, while the tolerable misstatement is $9,000, what would an auditor likely conclude?
A) Since the UML or Projected Misstatement is less than the tolerable misstatement, the account is not materially misstated.
B) Since the UML or Projected Misstatement is less than the tolerable misstatement, the account is misstated.
C) The analysis has been improperly performed since the UML or Projected Misstatement is unequal to the tolerable misstatement
In calculating the projected misstatement in monetary unit sampling, accounts with a book value larger than the sampling interval are extended to the projected misstatement at their:
Misstatement amount.
Actual book value.
Tainting percentage times the sampling interval.
Tainting percentage times their book value.
When using monetary unit sampling, a population is accepted as being materially correct when the:
Tolerable misstatement is greater than the upper limit on misstatement.
Incremental allowance is less than the upper limit on misstatement.
Projected misstatement is less than the upper limit on misstatement.
Basic precision is greater than the projected misstatement.
Chapter 17 Solutions
EBK AUDITING+ASSURANCE SERVICES
Ch. 17 - Prob. 1RQCh. 17 - Prob. 2RQCh. 17 - Prob. 3RQCh. 17 - Prob. 4RQCh. 17 - Prob. 5RQCh. 17 - Prob. 6RQCh. 17 - Prob. 7RQCh. 17 - Prob. 8RQCh. 17 - Prob. 9RQCh. 17 - Prob. 10RQ
Ch. 17 - Prob. 11RQCh. 17 - Prob. 12RQCh. 17 - Prob. 13RQCh. 17 - Prob. 14RQCh. 17 - Prob. 15RQCh. 17 - Prob. 16RQCh. 17 - Prob. 17RQCh. 17 - Prob. 18RQCh. 17 - Prob. 19RQCh. 17 - Prob. 20RQCh. 17 - Prob. 21.1MCQCh. 17 - Prob. 21.2MCQCh. 17 - Prob. 21.3MCQCh. 17 - Prob. 22.1MCQCh. 17 - Prob. 22.2MCQCh. 17 - Prob. 22.3MCQCh. 17 - Prob. 23.1MCQCh. 17 - Prob. 23.2MCQCh. 17 - Prob. 23.3MCQCh. 17 - Prob. 24.1MCQCh. 17 - Prob. 24.2MCQCh. 17 - Prob. 24.3MCQCh. 17 - Prob. 25DQPCh. 17 - Prob. 26DQPCh. 17 - Prob. 27DQPCh. 17 - Prob. 28DQPCh. 17 - Prob. 29DQPCh. 17 - Prob. 30DQPCh. 17 - Prob. 31DQPCh. 17 - Prob. 32DQPCh. 17 - Prob. 34DQPCh. 17 - Prob. 35DQP
Knowledge Booster
Similar questions
- Assume that an account with a recorded balance of $5,000 has an audited value of $3,000. By using monetary unit sampling, if the sampling interval is $1,500, the projected misstatement would bea. $600.b. $900.c. $2,000.d. $3,000.arrow_forwardSelect the necessary words from the list of possibilities to complete the following statements. 1. 2. 7. Inherent in the use of sampling is representative of the population. 9. When the auditors estimate sampling risk using professional judgment rather than by using the laws of probability, they are said to be using. sampling. an item from the population may be selected two or more times for inclusion in the When using sample. The term 3. 4. 5. In performing tests of controls, the auditors are primarily concerned with the risk of assessing 6. To use attributes sampling tables, the auditors must stipulate the desired risk of assessing control risk too low, the expected deviation rate in the population, and the desired Statements risk which is the possibility of selecting a sample that i not refers to the process of dividing a population into relatively homogeneous subgroups. sampling is usually used in situations in which the auditors expect a very low rate of occurrence of some…arrow_forwardWhich of the following statements is correct about monetary unit sampling?a. The risk of incorrect acceptance must be specified.b. Smaller logical units have a higher probability of selection in the sample than larger units.c. Each logical unit in the population has an equally likely chance of being selected in the sample.d. The projected misstatement cannot be calculated when one or more misstatements are discovered.arrow_forward
- Using AICPA sample evaluation tables, determine the conclusion from a statistical sampleof internal controls when a sample of 125 documents indicates five deviations if the tolerablerate of deviation is 5 percent, the expected population deviation rate is 2 percent, and theallowance for sampling risk is 3 percent.a. Accept the evidence as support for assessing a low control risk because the tolerable rateof deviation less the allowance for sampling risk is less than the expected populationdeviation rate.b. Use the evidence to assess a higher control risk than planned because the sample rate ofdeviation plus the allowance for sampling risk exceeds the tolerable rate of deviation.c. Use the evidence to assess a higher control risk than planned because the tolerable rate ofdeviation plus the allowance for sampling risk exceeds the expected population deviationrate.d. Accept the evidence as support for assessing a low control risk because the sample rate ofdeviation plus the allowance for…arrow_forwardConsider a population proportion p = 0.20. a. What are the expected value and the standard error for the sampling distribution of the sample proportion with n = 20 and n = 58? Note: Round the standard error to 4 decimal places. Answer is complete and correct. n Expected value Standard error 20 58 0.20 0.20 0.0894 0.0525 b. Can you conclude that the sampling distribution of the sample proportion is approximately normally distributed for both sample sizes? Yes, the sampling distribution of the sample proportion is normally distributed for both sample sizes. No, the sampling distribution of the sample proportion is not normally distributed for either sample size. No, only the sample proportion with n = 20 will have a normal distribution. No, only the sample proportion with n = 58 will have a normal distribution. c. If the sampling distribution of the sample proportion is normally distributed with n = 20, then calculate the probability that the sample proportion is between 0.18 and 0.20.…arrow_forwardMistakes in a Monetary Unit Sampling Application. Kelsey Mead, CPA, was engaged toaudit Jiffy Company’s financial statements for the year ended August 31.For the current year, Mead decided to use MUS to select accounts receivable for confirmation because MUS uses each account in the population as a separate sampling unit.Mead expected to discover many overstatements but presumed that the MUS sample sizestill would be smaller than the corresponding sample size for classical variables sampling.Mead reasoned that the MUS sample would automatically result in a stratified samplebecause each account would have an equal chance of being selected for confirmation. Additionally, the selection of negative (credit) balances would be facilitated without specialconsiderations.Mead computed the sample size using the risk of incorrect acceptance, the total recordedbook amount of the receivables, and the number of misstated accounts allowed. Meaddivided the total recorded book amount of the receivables…arrow_forward
- K Conduct a test at the α = 0.05 level of significance by determining (a) the null and alternative hypotheses, (b) the test statistic, and (c) the P-value. Assume the samples were obtained independently from a large population using simple random sampling. Test whether p₁> P2. The sample data are x₁ = 116, n₁ = 244, x2 = 132, and n₂ = 313. (a) Choose the correct null and alternative hypotheses below. OA. Ho P1 P2 versus H₁: P1 P2 OB. Ho P₁ P2 versus H₁: P₁ P2 OD. Ho p₁ =0 versus H₁:.p₁ #0 (b) Determine the test statistic. Zo= (Round to two decimal places as needed.) (c) Determine the P-value. The P-value is (Round to three decimal places as needed.) What is the result of this hypothesis test? OA. Do not reject the null hypothesis because there is not sufficient evidence to conclude that p₁ #p2- OB. Do not reject the null hypothesis because there is not sufficient evidence to conclude that p₁ P2- OD. Reject the null hypothesis because there is sufficient evidence to conclude that p₁…arrow_forwardSample Size Determination. For each of the following independent cases, use AICPA sample size tables to identify the missing value(s). Control 1 2 3 4 Risk of overreliance 5.0% 5.0% 10.0% (d) Expected population deviation rate 1.25% 2.5% (c) 1.25% Tolerable rate of deviation 7.0% (b) 6.0% 6.0% Sample size (a) 68 153 78arrow_forwardSample Size and Sampling Interval Determination: Monetary Unit Sampling. CaseyPaul is considering the use of MUS in examining Stanley’s accounts receivable, which wererecorded at $300,000. Using the audit risk model, Paul has identified a necessary risk ofincorrect acceptance of 10 percent and has established a tolerable misstatement of $25,000and an expected misstatement of $10,000.Required:a. Determine the necessary sample size for the audit of Stanley’s accounts receivable.b. Based on the sample size determined in part (a), what is the appropriate sampling interval?c. Briefly describe how Paul would select the sample from a computerized customer listthat Stanley maintains.d. How would each of the following changes in Paul’s sampling plan impact the sample size andsampling interval? For each change, use the original parameters noted in the problem. (Verifyyour answer by calculating the sample size associated with each change.)1. A reduction in the necessary level of the risk of…arrow_forward
- The upper precision limit (CUER) in statistical sampling is(1) the percentage of items in a sample that possess a particular attribute.(2) the percentage of items in a population that possess a particular attribute.(3) a statistical measure, at a specified confidence level, of the maximum rate ofoccurrence of an attribute.(4) the maximum rate of exception that the auditor would be willing to accept inthe population without altering the planned reliance on the attribute.arrow_forwardConsider a sample with data values of 10, 20, 12, 17, and 16. a. Compute the mean and median. b. Consider a sample with data values 10, 20, 12, 17, 16, and 12. How would you expect the mean and median for these sample data to compare to the mean and median for part a (higher, lower, or the same)? Compute the mean and median for the sample data 10, 20, 12, 17, 16, and 12.arrow_forwardPlease answer asaparrow_forward
arrow_back_ios
SEE MORE QUESTIONS
arrow_forward_ios
Recommended textbooks for you
- Auditing: A Risk Based-Approach (MindTap Course L...AccountingISBN:9781337619455Author:Karla M Johnstone, Audrey A. Gramling, Larry E. RittenbergPublisher:Cengage LearningEssentials of Business Analytics (MindTap Course ...StatisticsISBN:9781305627734Author:Jeffrey D. Camm, James J. Cochran, Michael J. Fry, Jeffrey W. Ohlmann, David R. AndersonPublisher:Cengage LearningAuditing: A Risk Based-Approach to Conducting a Q...AccountingISBN:9781305080577Author:Karla M Johnstone, Audrey A. Gramling, Larry E. RittenbergPublisher:South-Western College Pub
Auditing: A Risk Based-Approach (MindTap Course L...
Accounting
ISBN:9781337619455
Author:Karla M Johnstone, Audrey A. Gramling, Larry E. Rittenberg
Publisher:Cengage Learning
Essentials of Business Analytics (MindTap Course ...
Statistics
ISBN:9781305627734
Author:Jeffrey D. Camm, James J. Cochran, Michael J. Fry, Jeffrey W. Ohlmann, David R. Anderson
Publisher:Cengage Learning
Auditing: A Risk Based-Approach to Conducting a Q...
Accounting
ISBN:9781305080577
Author:Karla M Johnstone, Audrey A. Gramling, Larry E. Rittenberg
Publisher:South-Western College Pub