
Concept explainers
Videos
Recompute the regression fits from Probs. (a) 17.3 and (b) 17.17, using the matrix approach. Estimate the standard errors and develop 90% confidence intervals for the coefficients.
(a)
To calculate: The coefficient of the regression fit equation of the given databy the use of matrix approach and then calculate standard error and
| x | 0 | 2 | 4 | 6 | 9 | 11 | 12 | 15 | 17 | 19 |
| y | 5 | 6 | 7 | 6 | 9 | 8 | 7 | 10 | 12 | 12 |
Answer to Problem 22P
Solution:
The value of coefficient by the use of matrix approach is
Explanation of Solution
Given Information:
The data is,
| x | 0 | 2 | 4 | 6 | 9 | 11 | 12 | 15 | 17 | 19 |
| y | 5 | 6 | 7 | 6 | 9 | 8 | 7 | 10 | 12 | 12 |
Calculation:
The coefficient of the regression fit equation can be found out by the Matrix approach by following the below steps,
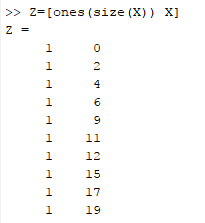
Step 1. First make Z matrix that contain column of ones in the first column and in the second column x value is shown.
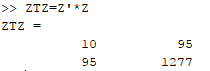
Step 2. Now the coefficient of normal equation is made.
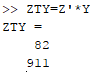
Step 3. Now compute the normal equation of the right hand side that is y data.
Step 4. The coefficient of the model can be found out by taking inverse of the result obtained in step 2 and step 3.
The following MATLAB will perform the desired steps,
On the command window, write this command as,
Now, the coefficient of normal equation is calculated as,
Now, the normal equation of y is calculated as,
Finally, the coefficient of the model can be found out,
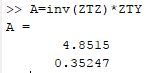
Therefore, the value of coefficientis
Now, for calculating the standard error follow these commands,
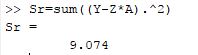
Now calculate
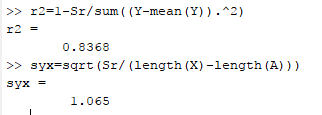
The standard error of the given data is
Now for calculating
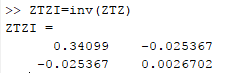
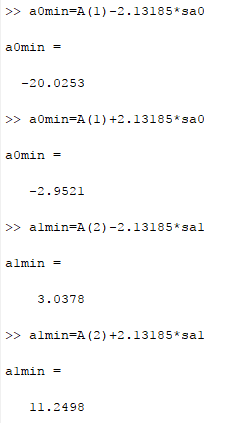
Then the standard error of each coefficient,
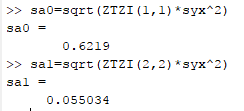
Thevalue of
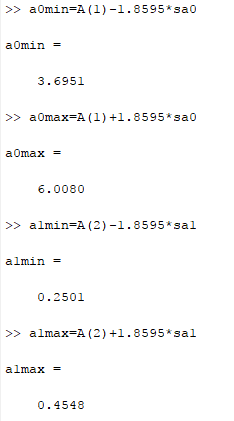
Hence, the
(b)
To calculate: The coefficient of the regression fit cubic equation of the given databy the use of matrix approach and then calculate standard error and
| x | 3 | 4 | 5 | 7 | 8 | 9 | 11 | 12 |
| y | 1.6 | 3.6 | 4.4 | 3.4 | 2.2 | 2.8 | 3.8 | 4.6 |
Answer to Problem 22P
Solution:
The value of coefficient by the use of matrix approach is
Explanation of Solution
Given Information:
The data is,
| x | 3 | 4 | 5 | 7 | 8 | 9 | 11 | 12 |
| y | 1.6 | 3.6 | 4.4 | 3.4 | 2.2 | 2.8 | 3.8 | 4.6 |
Calculation:
The coefficient of the regression fit equation can be found out by the Matrix approach by following the below steps,
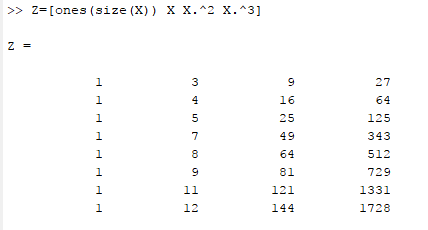
Step 1. First make Z matrix that contain column of ones in the first column and in the second column x value is shown.
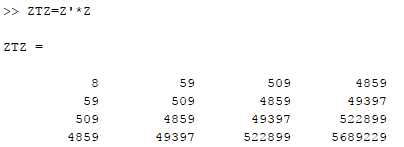
Step 2. Now the coefficient of normal equation is made.
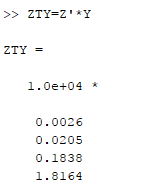
Step 3. Now compute the normal equation of the right hand side that is y data.
Step 4. The coefficient of the model can be found out by taking inverse of the result obtained in step 2 and step 3.
The following MATLAB will perform the desired steps,
On the command window, write this commandfor cubic equation as,
Now, the coefficient of normal equation is calculated as,
Now, the normal equation of y is calculated as,
Finally, the coefficient of the model can be found out,
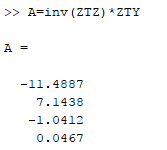
Therefore, the value of coefficient is
Now, for calculating the standard error follow these commands,
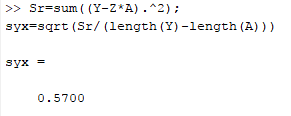
The standard error of the given data is
Now for calculating
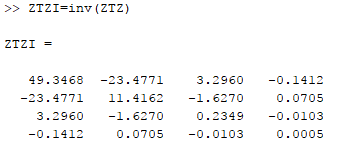
Then the standard error of each coefficient,
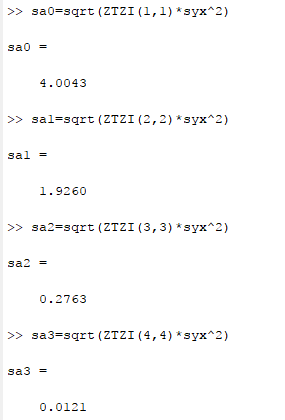
The value of
And,
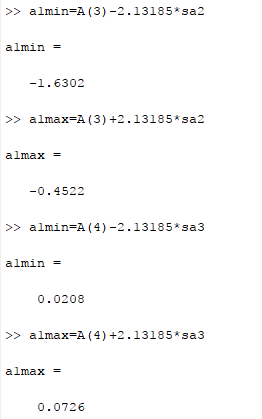
Hence, the
Want to see more full solutions like this?
Chapter 17 Solutions
Numerical Methods For Engineers, 7 Ed


- Find the volume of the figure. The volume of the figure is 3 m 3 m 3 marrow_forwardFind the circumference and area of the circle. Express answers in terms of and then round to the nearest tenth. Find the circumference in terms of C= (Type an exact answer in terms of x.) Find the circumference rounded to the nearest tenth. C= Find the area in terms of A= (Type an exact answer in terms of x.) Find the area rounded to the nearest tenth. A= 10 cmarrow_forwardIn Exercises 62-64, sketch a reasonable graph that models the given situation. The number of hours of daylight per day in your hometown over a two-year period The motion of a diving board vibrating 10 inches in each direction per second just after someone has dived off The distance of a rotating beam of light from a point on a wallarrow_forward
- The manager of a fleet of automobiles is testing two brands of radial tires and assigns one tire of each brand at random to the two rear wheels of eight cars and runs the cars until the tires wear out. The data (in kilometers) follow. CAR BRAND1 BRAND2 DIFFERENCE = (BRAND1 - BF 1 36,925 33,018 3,907 2 45,300 43,280 2,020 3 36,240 35,500 740 4 32,100 31,200 900 5 37,210 37,015 195 6 48,360 46,800 1,560 7 38,200 37,810 390 8 33,500 33,215 285arrow_forwardDiabetes and obesity are serious health concerns in the United States and much of the developed world. Measuring the amount of body fat a person carries is one way to monitor weight control progress, but measuring it accurately involves either expensive X-ray equipment or a pool in which to dunk the subject. Instead body mass index (BMI) is often used as a proxy for body fat because it is easy to measure: BMI = mass(kg)/(height(m))² = 703 mass(lb)/(height(in))². In a study of 15 men at TXST, both BMI and body fat were measured. Researchers imported the data into statistical software for analysis. A few values are missing from the output. Complete the table by filling in the missing values. Model Summary S R-sq % (three decimal places) (two decimal places. e.g. 12.3456%, enter 12.35) Analysis of Variance Source Model Error Total DF SS MS F P 17.600 0.001 DF: whole numbers SS or MS; three decimal places 34.810 Does a simple linear regression model seem reasonable in this situation?…arrow_forwardThe use of electromyostimulation (EMS) as a method to train healthy skeletal muscle is studied. EMS sessions consisted of 30 contractions (4-second duration, 85 Hz) and were carried out three times per week for three weeks on 17 ice hockey players. The 10-meter skating performance test showed a standard deviation of 0.90 seconds. Is there strong evidence to conclude that the standard deviation of performance time exceeds the historical value of 0.75 seconds? Use a = 0.05.arrow_forward
- One-Sample Z Test Test of М = 45 vs not === 45 The assumed standard deviation = 2.8 VARIABLE N MEAN STDEV SE MEAN X Instructions: 46.377 2.500 0.626 95% CI (,) Fill in the missing values. N: Round the answer to the nearest whole number. Cl: Round to three decimal places. Z: Round to two decimal places. P: Round to three decimal places.arrow_forwardNeed detailed report solution without AI and Chatgpt,arrow_forwardBased on the software output, write the fitted simple linear regression equation. Coefficients Term Coef SE Coef T-Value P-Value Constant 3.20 1.92 1.67 0.237 [Select] y= 0.600 0.566 1.06 0.400 +[Select] x Does a simple linear regression model seem reasonable in this situation? [Select]arrow_forward
- 30.4. Suppose that f(2) has a pole of order m at zo. Show that f'(z) has a pole of order m + 1 at zo-arrow_forwardA drink filling machine, when in perfect adjustment, fills the bottles with 8 ounces of drink on an average. Any overfilling or underfilling results in the shutdown and readjustment of the machine. A sample of 20 bottles is selected, and the sample shows an average filling volume of 7.5 ounces. To determine whether the machine is properly adjusted, the correct set of hypotheses Ho: [Select] [Select] H₁: [Select] [Select] > [Select] [Select]arrow_forwardInformation on a packet of seeds claims that 93% of them will germinate. Of the 200 seeds that were planted, only 180 germinated. 95% confidence interval for the true proportion of seeds that germinate based on this sample is (85.8%, 94.2%). Do the data provide evidence against the claim? [Select] The margin of error in the estimate is: [Select] > To keep the margin of error within 3.5% with at least 95% confidence level, the required sample size is: [Select]arrow_forward
 Big Ideas Math A Bridge To Success Algebra 1: Stu...AlgebraISBN:9781680331141Author:HOUGHTON MIFFLIN HARCOURTPublisher:Houghton Mifflin Harcourt
 Trigonometry (MindTap Course List)TrigonometryISBN:9781305652224Author:Charles P. McKeague, Mark D. TurnerPublisher:Cengage Learning
 Elementary Linear Algebra (MindTap Course List)AlgebraISBN:9781305658004Author:Ron LarsonPublisher:Cengage Learning
 Algebra & Trigonometry with Analytic GeometryAlgebraISBN:9781133382119Author:SwokowskiPublisher:Cengage
 College AlgebraAlgebraISBN:9781305115545Author:James Stewart, Lothar Redlin, Saleem WatsonPublisher:Cengage Learning
 Algebra and Trigonometry (MindTap Course List)AlgebraISBN:9781305071742Author:James Stewart, Lothar Redlin, Saleem WatsonPublisher:Cengage Learning