Concept explainers
Videos
A fun fact: You can use a microwave oven and a bar of chocolate to measure the speed of light. Really! Microwaves are electromagnetic waves, just like visible light. The difference is the wavelength of these waves: For visible light, the wavelengths are in the neighborhood of
If your teacher is unusually adventurous, he or she might bring in a microwave and chocolate bars, in which case you can perform the experiment on your own. Start with around 20 seconds, and make sure you take out the carousel: The chocolate has to stay stationary. (And now you know why a lot of microwaves have a carousel: Food heats more thoroughly at the spots corresponding to half of the wavelength.)
In case no microwave and chocolate are available, I did the experiment at home and took a picture for you, which is reproduced below. It’s a life-size scale, so you can measure the distance between the melted spots with a ruler.
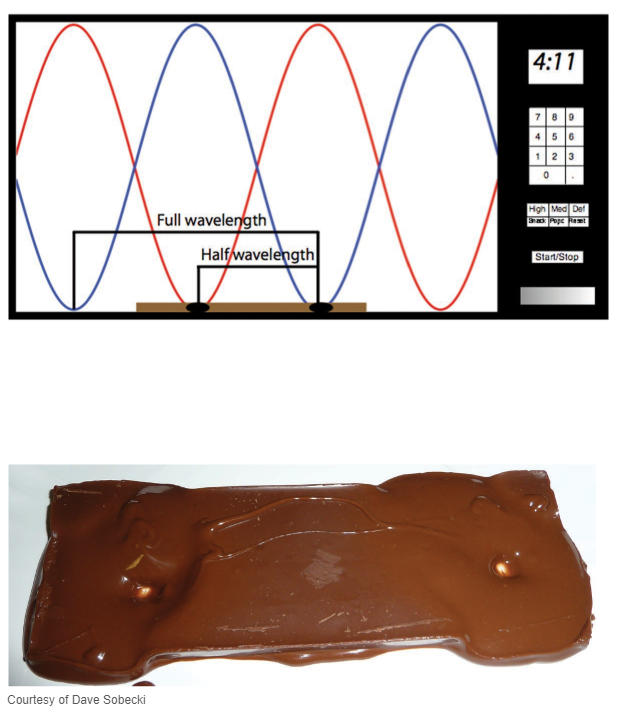
Measure the distance between melted spots on your chocolate, trying to measure from center to center. Record your distance below, remembering that this is half the wavelength of the microwaves.
Want to see the full answer?
Check out a sample textbook solution
Chapter 1 Solutions
PATHWAYS TO MATH LITERACY (LL)-W/ACCESS


- WHAT IS THE SOLUTION?arrow_forwardAnswer questions 2arrow_forwardThe following ordered data list shows the data speeds for cell phones used by a telephone company at an airport: A. Calculate the Measures of Central Tendency from the ungrouped data list. B. Group the data in an appropriate frequency table. C. Calculate the Measures of Central Tendency using the table in point B. 0.8 1.4 1.8 1.9 3.2 3.6 4.5 4.5 4.6 6.2 6.5 7.7 7.9 9.9 10.2 10.3 10.9 11.1 11.1 11.6 11.8 12.0 13.1 13.5 13.7 14.1 14.2 14.7 15.0 15.1 15.5 15.8 16.0 17.5 18.2 20.2 21.1 21.5 22.2 22.4 23.1 24.5 25.7 28.5 34.6 38.5 43.0 55.6 71.3 77.8arrow_forward
- How does a fourier transform works?arrow_forwardProve that (1) Σσς (α) μ(η/α) = n d/n (ii) Σσς(d) = η Σσο(α)/d d❘n d❘n (iii) σ (d) σ (n/d) = Σ d³oo(d) σo(n/d). d|n dnarrow_forwardII Consider the following data matrix X: X1 X2 0.5 0.4 0.2 0.5 0.5 0.5 10.3 10 10.1 10.4 10.1 10.5 What will the resulting clusters be when using the k-Means method with k = 2. In your own words, explain why this result is indeed expected, i.e. why this clustering minimises the ESS map.arrow_forward
 College Algebra (MindTap Course List)AlgebraISBN:9781305652231Author:R. David Gustafson, Jeff HughesPublisher:Cengage Learning
 Elementary Geometry For College Students, 7eGeometryISBN:9781337614085Author:Alexander, Daniel C.; Koeberlein, Geralyn M.Publisher:Cengage,
 Elementary Geometry for College StudentsGeometryISBN:9781285195698Author:Daniel C. Alexander, Geralyn M. KoeberleinPublisher:Cengage Learning
 Glencoe Algebra 1, Student Edition, 9780079039897...AlgebraISBN:9780079039897Author:CarterPublisher:McGraw Hill