
Concept explainers
Videos
Consider the
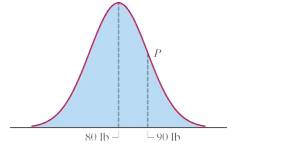
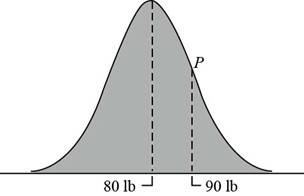
Figure 17-12
a. Find the mean
b. Find the median M of the distribution.
c. Find the standard deviation
(a)
To find:
The mean
Answer to Problem 1E
Solution:
The mean
Explanation of Solution
Given:
The normal distribution curve is,

With P as a point of inflection of the curve.
Definition:
The point of intersection of the horizontal (data) axis and the line of symmetry of the normal curve, the center of the distribution. The center corresponds to both the median and mean of the distribution.
Calculation:
From the given figure, it is seen that the point of intersection of the horizontal axis and the line of symmetry is at
This implies that the mean
Conclusion:
The mean
(b)
To find:
The median M of the distribution.
Answer to Problem 1E
Solution:
The median M of the distribution is
Explanation of Solution
Given:
The normal distribution curve is,
With P as a point of inflection of the curve.
Definition:
The point of intersection of the horizontal (data) axis and the line of symmetry of the normal curve, the center of the distribution. The center corresponds to both the median and mean of the distribution.
Calculation:
From the given figure, it is seen that the point of intersection of the horizontal axis and the line of symmetry is at
This implies that the median M of the distribution.is
Conclusion:
The median M of the distribution is
(c)
To find:
The standard deviation
Answer to Problem 1E
Solution:
The standard deviation
Explanation of Solution
Given:
The normal distribution curve is,

With P as a point of inflection of the curve.
Definition:
The standard deviation of the normal distribution is the horizontal distance between the axis of symmetry of the curve and one of the two points of inflection.
Calculation:
From the given figure, it is seen that the point of intersection of the horizontal axis and the line of symmetry is at
The point of inflection of the curve is
Therefore the distance between the point of inflection and the line of symmetry is,
This implies that the standard deviation
Conclusion:
The standard deviation
Want to see more full solutions like this?
Chapter 17 Solutions
Excursions in Modern Mathematics (9th Edition)


- Definition: A topology on a set X is a collection T of subsets of X having the following properties. (1) Both the empty set and X itself are elements of T. (2) The union of an arbitrary collection of elements of T is an element of T. (3) The intersection of a finite number of elements of T is an element of T. A set X with a specified topology T is called a topological space. The subsets of X that are members of are called the open sets of the topological space.arrow_forwardDefinition: A topology on a set X is a collection T of subsets of X having the following properties. (1) Both the empty set and X itself are elements of T. (2) The union of an arbitrary collection of elements of T is an element of T. (3) The intersection of a finite number of elements of T is an element of T. A set X with a specified topology T is called a topological space. The subsets of X that are members of are called the open sets of the topological space.arrow_forward3) Let a1, a2, and a3 be arbitrary real numbers, and define an = 3an 13an-2 + An−3 for all integers n ≥ 4. Prove that an = 1 - - - - - 1 - - (n − 1)(n − 2)a3 − (n − 1)(n − 3)a2 + = (n − 2)(n − 3)aı for all integers n > 1.arrow_forward
- Definition: A topology on a set X is a collection T of subsets of X having the following properties. (1) Both the empty set and X itself are elements of T. (2) The union of an arbitrary collection of elements of T is an element of T. (3) The intersection of a finite number of elements of T is an element of T. A set X with a specified topology T is called a topological space. The subsets of X that are members of are called the open sets of the topological space.arrow_forwardDefinition: A topology on a set X is a collection T of subsets of X having the following properties. (1) Both the empty set and X itself are elements of T. (2) The union of an arbitrary collection of elements of T is an element of T. (3) The intersection of a finite number of elements of T is an element of T. A set X with a specified topology T is called a topological space. The subsets of X that are members of are called the open sets of the topological space.arrow_forwardDefinition: A topology on a set X is a collection T of subsets of X having the following properties. (1) Both the empty set and X itself are elements of T. (2) The union of an arbitrary collection of elements of T is an element of T. (3) The intersection of a finite number of elements of T is an element of T. A set X with a specified topology T is called a topological space. The subsets of X that are members of are called the open sets of the topological space.arrow_forward
- u, v and w are three coplanar vectors: ⚫ w has a magnitude of 10 and points along the positive x-axis ⚫ v has a magnitude of 3 and makes an angle of 58 degrees to the positive x- axis ⚫ u has a magnitude of 5 and makes an angle of 119 degrees to the positive x- axis ⚫ vector v is located in between u and w a) Draw a diagram of the three vectors placed tail-to-tail at the origin of an x-y plane. b) If possible, find w × (ū+v) Support your answer mathematically or a with a written explanation. c) If possible, find v. (ū⋅w) Support your answer mathematically or a with a written explanation. d) If possible, find u. (vxw) Support your answer mathematically or a with a written explanation. Note: in this question you can work with the vectors in geometric form or convert them to algebraic vectors.arrow_forwardQuestion 3 (6 points) u, v and w are three coplanar vectors: ⚫ w has a magnitude of 10 and points along the positive x-axis ⚫ v has a magnitude of 3 and makes an angle of 58 degrees to the positive x- axis ⚫ u has a magnitude of 5 and makes an angle of 119 degrees to the positive x- axis ⚫ vector v is located in between u and w a) Draw a diagram of the three vectors placed tail-to-tail at the origin of an x-y plane. b) If possible, find w × (u + v) Support your answer mathematically or a with a written explanation. c) If possible, find v. (ū⋅ w) Support your answer mathematically or a with a written explanation. d) If possible, find u (v × w) Support your answer mathematically or a with a written explanation. Note: in this question you can work with the vectors in geometric form or convert them to algebraic vectors.arrow_forward39 Two sides of one triangle are congruent to two sides of a second triangle, and the included angles are supplementary. The area of one triangle is 41. Can the area of the second triangle be found?arrow_forward
 Big Ideas Math A Bridge To Success Algebra 1: Stu...AlgebraISBN:9781680331141Author:HOUGHTON MIFFLIN HARCOURTPublisher:Houghton Mifflin Harcourt
 Glencoe Algebra 1, Student Edition, 9780079039897...AlgebraISBN:9780079039897Author:CarterPublisher:McGraw Hill