
Concept explainers
(a)
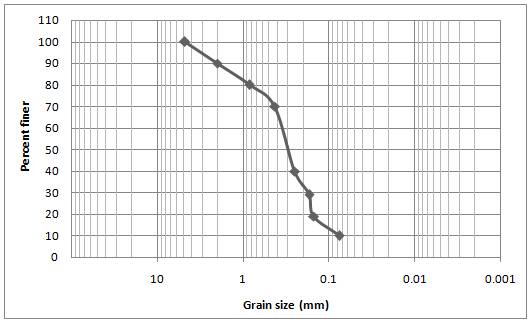
To plot: Grain size distribution curve.
Answer to Problem 18P

Explanation of Solution
Given information:
| Sieve No. | Sieve No. | Percent finer |
| | | |
| | | |
| | | |
| | | |
| | | |
| | | |
| | | |
| | | |
| Pan | Pan | -- |
Concept used:
Plot the grain size distribution curve between the sieve number (mm) and the percent finer. The sieve number (mm) is plotted in x -axis and percent finer in y -axis.
Calculation:
Conclusion:
The grain distribution curve is plotted.
(b)
The values of
Answer to Problem 18P
Explanation of Solution
Given information:
| Sieve No. | Sieve No. | Percent finer |
| | | |
| | | |
| | | |
| | | |
| | | |
| | | |
| | | |
| | | |
| Pan | Pan | -- |
Concept used:
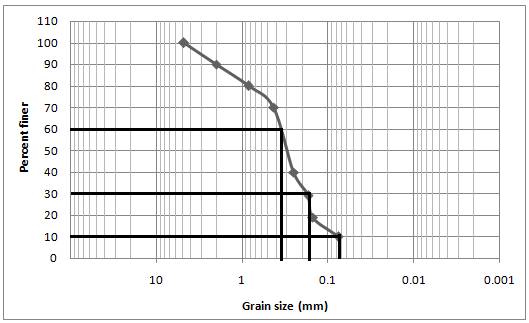
Plot the grain size distribution curve between the sieve number (mm) and the percent finer. The sieve number (mm) is plotted in x -axis and percent finer in y -axis. Then the corresponding values of
Calculation:
Conclusion:
The values of
(c)
The value of uniformity coefficient
Answer to Problem 18P
Explanation of Solution
Given information:
| Sieve No. | Sieve No. | Percent finer |
| | | |
| | | |
| | | |
| | | |
| | | |
| | | |
| | | |
| | | |
| Pan | Pan | -- |
Concept used:
Calculation:
Conclusion:
The value of coefficient of uniformityis
(d)
The value of coefficient of gradation
Answer to Problem 18P
Explanation of Solution
Given information:
| Sieve No. | Sieve No. | Percent finer |
| | | |
| | | |
| | | |
| | | |
| | | |
| | | |
| | | |
| | | |
| Pan | Pan | -- |
Concept used:
Calculation:
Conclusion:
The value of coefficient of uniformity is
Want to see more full solutions like this?


- Determine the stiffness matrices of elements 2, 3 and 4 in the global co-ordinate system. Assume A=0.0015m2 and E=200GPa, indicate the degrees of freedom in all stiffness matricies.arrow_forwardA short plain concrete column with cross-section dimensions of 12 in x 12 in is to be constructed. If the compressive strength of the concrete (f’c) is 5000 psi, what is the maximum load that can be safely applied to the column? - 600 k - 950 k - 720 k - 347 karrow_forwardThe borrow pit has 2000 cyds of suitable fill. The fill required for the project is 1900 cyds. The swell factor is 10% and the shrinkage factor is 15%. How much more borrow do we need? Or is there extra? - 13 yards extra - 13 yards short - 200 yards extra - 161 yards shortarrow_forward
- The job site has a primary vertical control point with a reference benchmark of 100 ft. An instrument is set up with an HI of 5.42 ft above the BM. A grade stake is set at an elevation of 96 ft. What is the height reading on the rod at the grade stake? - 9.42 ft - 4.00 ft - 1.42 ft - 5.42 ftarrow_forwardAssume you have a simple beam 16 ft long supported on each end by R1 and R2. There is a concentrated load of 900 lb that is 4 ft from R2. Reaction R1 is pinned 12 ft from the load. Reaction R1 is 225 lb and R2 is 675 lb. What is the maximum bending moment in pounds per foot? - 3,600 - 1,800 - 2,700- 900arrow_forwardA wall form is four-feet high, ten-feet long and ten-feet wide. It is full of fluid concrete. What is the pressure at the bottom of the form? - 86,400 psi - 60,000 psf - 600 psf - 60,000 psiarrow_forward
- he sides of a building are 300 feet long and 200 feet wide. What is the diagonal distance between the opposite corners? - 300 feet - 306 feet - 360.60 feet - 306.6 feetarrow_forwardThe excavation for a square basement requires a 1:2 H:V slope cut back. The external dimensions of the footings are 30 x 30 feet. The excavation is 8 feet deep and you need to add 2 feet on each side to install the footing forms. What is the volume of cubic yards of excavation? - 486.7cy - 13140cy - 858.8cy - 429.4cyarrow_forwardThe Modulus of Elasticity is 30,000,000 for mild carbon steel. In the plastic state, the unit stress is 25000 psi. What is the strain? - 1.45 - 145.0 - 0.00083 - 1450.0arrow_forward
- The building is twenty-five feet by twenty five feet. The side line of the building and two corners along the line have been staked. What is the diagonal distance and the 90 degree distance to the other corners? - 35.36 feet and 35.36 feet - 25.00 feet and 35.36 feet - 35.36 feet and 25 feet - 25.00 feet and 25.00 feetarrow_forwardNEED HELP THANK YOU IN ADVACEarrow_forwardNEED HELP THANK YOU IN ADVANCEarrow_forward
 Fundamentals of Geotechnical Engineering (MindTap...Civil EngineeringISBN:9781305635180Author:Braja M. Das, Nagaratnam SivakuganPublisher:Cengage Learning
 Principles of Geotechnical Engineering (MindTap C...Civil EngineeringISBN:9781305970939Author:Braja M. Das, Khaled SobhanPublisher:Cengage Learning
 Traffic and Highway EngineeringCivil EngineeringISBN:9781305156241Author:Garber, Nicholas J.Publisher:Cengage Learning
 Principles of Foundation Engineering (MindTap Cou...Civil EngineeringISBN:9781337705028Author:Braja M. Das, Nagaratnam SivakuganPublisher:Cengage Learning
 Principles of Foundation Engineering (MindTap Cou...Civil EngineeringISBN:9781305081550Author:Braja M. DasPublisher:Cengage Learning