
Interpretation:
The rate constant for the decomposition of a certain substance is
Concept Introduction:
Arrhenius Equation:
The temperature dependence characteristics of reaction is normally expressed mathematically by introducing two parameters, one representing the intercept and the other the slop of the straight line of a so-called ‘Arrhenius plot’ of
A is the parameter obtained from the intercept of the line at
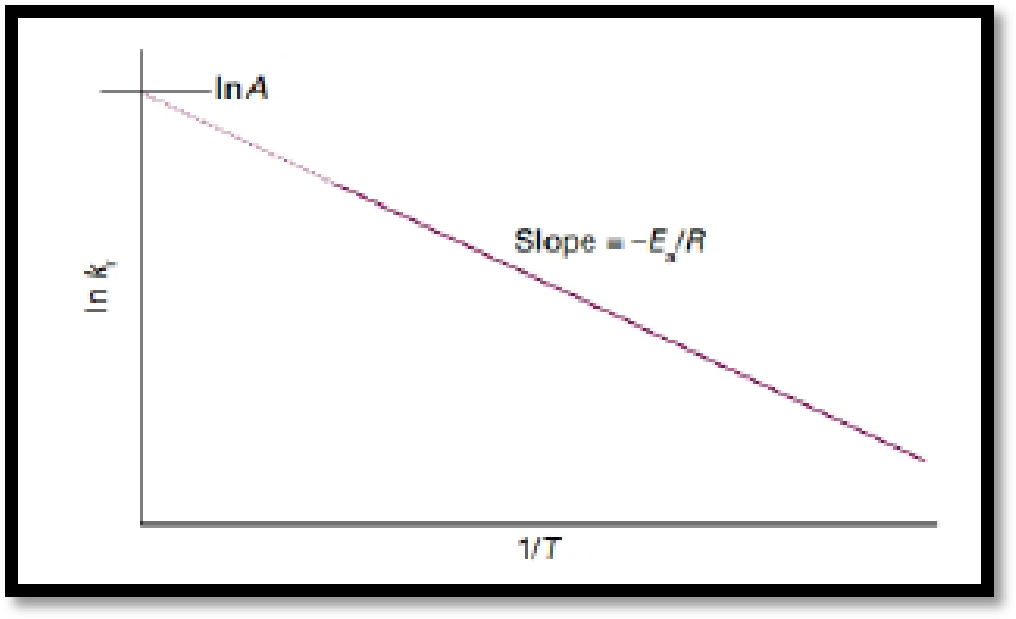
Figure.1
If the activation energy of a reaction is known, the value of a rate constant
That is:
Want to see the full answer?
Check out a sample textbook solution
Chapter 17 Solutions
Student Solutions Manual to accompany Atkins' Physical Chemistry 11th edition

- 16) A 2.0 L flask containing 2.0 x 10⁻³ mol H2(g), 3.0 x 10⁻³ mol Cl2(g), and 4.0 x 10⁻³ mol HCl(g) at equilibrium. This system is represented by the following chemical equation: H2 (g) + Cl2 (g) → 2HCl(g) Calculate the equilibrium constant for this reaction.arrow_forward7) The pH of a 0.05M solution of HCl(aq) at 25°C is a. 1.3 b. 2.3 c. 3.3 d. 12.7arrow_forward11) The Ksp expression for copper (II) sulfate is: a. [Cu2+][SO4²¯] b. [Cu²+]² [SO4²]² c. [Cu²+]²[SO4²] d. [CuSO4] 12) Which of the following is true about a chemical system in equilibrium? a. All chemical reactions have stopped b. The concentration of reactants is equal to the concertation of products c. The forward and reverse reaction rates become equal d. The system will remain at equilibrium regardless of any external factorsarrow_forward
- 21) Explain the difference between the rate of a reaction and the extent of a reaction. Why are both of these concepts important, if you are a chemical engineer that is trying to develop a process to produce a large volume of a specific type of chemical compound?arrow_forwardPls help.arrow_forwardPls help.arrow_forward
- Pls help.arrow_forwardhelparrow_forwardDone 11:14 ⚫ worksheets.beyondlabz.com 5 (a). Using the peak information you listed in the tables for both structures, assign each peak to that portion of the structure that produces the peak in the NMR spectrum. Draw this diagram on your own sheet of paper and attach the sketch of your drawing to this question. Question 6 5 (b). Using the peak information you listed in the tables for both structures, assign each peak to that portion of the structure that produces the peak in the NMR spectrum. Draw this diagram on your own sheet of paper and attach the sketch of your drawing to this question. Question 7 6. Are there any differences between the spectra you obtained in Beyond Labz and the predicted spectra? If so, what were the differences? <arrow_forward
 ChemistryChemistryISBN:9781305957404Author:Steven S. Zumdahl, Susan A. Zumdahl, Donald J. DeCostePublisher:Cengage Learning
 ChemistryChemistryISBN:9781259911156Author:Raymond Chang Dr., Jason Overby ProfessorPublisher:McGraw-Hill Education
 Principles of Instrumental AnalysisChemistryISBN:9781305577213Author:Douglas A. Skoog, F. James Holler, Stanley R. CrouchPublisher:Cengage Learning
 Organic ChemistryChemistryISBN:9780078021558Author:Janice Gorzynski Smith Dr.Publisher:McGraw-Hill Education
 Chemistry: Principles and ReactionsChemistryISBN:9781305079373Author:William L. Masterton, Cecile N. HurleyPublisher:Cengage Learning
 Elementary Principles of Chemical Processes, Bind...ChemistryISBN:9781118431221Author:Richard M. Felder, Ronald W. Rousseau, Lisa G. BullardPublisher:WILEY