
EBK ELEMENTARY SURVEYING
15th Edition
ISBN: 8220106714225
Author: GHILANI
Publisher: PEARSON
expand_more
expand_more
format_list_bulleted
Question
Chapter 17, Problem 17.1P
To determine
A list of methods that can be used to display relief on a map.
Expert Solution & Answer
Explanation of Solution
- Contours are the most common method used to show relief or elevation in a topo map. Contour lines are the imaginary lines that join same elevation above the mean sea level. The elevation represents the vertical height from mean sea level. Contour lines to display relief are shown in fig.1.
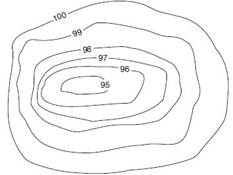
Fig.1
- Form lines are the approximate contours lines which do not shows the accurate elevations. Form lines are used to find the minor details in a topo map. Form lines are represented as dashed lines and it is no labeled with the representative elevations.
- Spot heights are denoted by a black dot followed by a number, which shows the accurate height of the place and the number denotes the height of the place.
- Hachures are the discontinuous parallel lines drawn along the direction of maximum slope, which does not represent the accurate elevation and is mainly used to show large, rocky outcrop areas. These lines are drawn thickly on the high slopes and thinly on the low slope.
- Layer tinting is the method of representing different elevations by means of color. A different color is used to represent each elevation. Layer tinting does not show the accurate height of the specific place.
Want to see more full solutions like this?
Subscribe now to access step-by-step solutions to millions of textbook problems written by subject matter experts!
Students have asked these similar questions
Please solve this question step by step with dia gram
Use the second picture to answer the question, Thank you so much for your help!
P6.16 A compound shaft (Figure P6.16) consists of a titanium alloy [G= 6,200 ksi] tube (1) and a solid stainless steel [G= 11,500 ksi] shaft (2). Tube (1) has a length L₁ = 40 in., an outside diameter D₁ = 1.75 in., and a wall thickness t₁ = 0.125 in. Shaft (2) has a
length 42 = 50 in. and a diameter d₂ = 1.25 in. If an external torque TB = 580 lb ft acts at pulley B in the direction shown, calculate the torque Tcrequired at pulley C so that the rotation angle of pulley Crelative to A is zero.
B
Te
(2)
TB
(1)
FIGURE P6.16
Chapter 17 Solutions
EBK ELEMENTARY SURVEYING
Ch. 17 - Prob. 17.1PCh. 17 - Prob. 17.2PCh. 17 - Prob. 17.3PCh. 17 - Prob. 17.4PCh. 17 - Prob. 17.5PCh. 17 - Prob. 17.6PCh. 17 - Prob. 17.7PCh. 17 - Prob. 17.8PCh. 17 - Prob. 17.9PCh. 17 - Prob. 17.10P
Ch. 17 - Prob. 17.11PCh. 17 - Prob. 17.12PCh. 17 - Prob. 17.13PCh. 17 - Prob. 17.14PCh. 17 - Prob. 17.15PCh. 17 - Prob. 17.16PCh. 17 - Prob. 17.17PCh. 17 - Prob. 17.18PCh. 17 - Prob. 17.19PCh. 17 - Prob. 17.20PCh. 17 - Prob. 17.21PCh. 17 - Prob. 17.22PCh. 17 - Prob. 17.23PCh. 17 - Prob. 17.24PCh. 17 - Prob. 17.25PCh. 17 - Prob. 17.26PCh. 17 - Prob. 17.27PCh. 17 - Prob. 17.28PCh. 17 - Prob. 17.29PCh. 17 - Prob. 17.30PCh. 17 - Prob. 17.31PCh. 17 - Prob. 17.32PCh. 17 - Prob. 17.33PCh. 17 - Prob. 17.34PCh. 17 - Prob. 17.35P
Knowledge Booster

Similar questions
- 7.43 Neglecting head losses, determine what horsepower the pump must deliver to produce the flow as shown. Here, the elevations at points A, B, C, and D are 124 ft, 161 ft, 110 ft, and 90 ft, respectively. The nozzle area is 0.10 ft². B Nozzle Water C Problem 7.43arrow_forwardA 1.8m x 1.8m footing is located at a depth of 1 m below the ground surface in a deep deposit of compacted sand (f'= 33 , f' = 28 , γ = 17.5 kN/m). Calculate the ultimate net bearing capacity considering several factors (e.g., shape, depth, and inclination) when the groundwater table is located (a) at 5 m below the footing base, (b) at the ground surface, (c) at the footing base, and (d) at 1.5 m below the footing base. Also, explain the effects of the groundwater levels in the bearing capacities of the footing with your own words. If the information is not given for the calculation, please assume it reasonably.arrow_forward7.18 Determine the discharge in the pipe and the pressure at point B. Neglect head losses. Assume α = 1.0 at all locations. 1.5 m Water B 3.5 m 40 cm diameter -20 cm diameter nozzle Problem 7.18arrow_forward
- A 200-lb block is at rest on a 30° inclined plane. The coefficient of friction between the block and the inclined plane is 0.20. Compute the value of a horizontal force P that will cause motion to impend the block up the inclined plane. 200 lb P 30°arrow_forwardPlease explain step by steparrow_forwardProblem 1 = = = 13,600 Manometers can be used in combination with cardiovascular catheters to measure blood pressure based on height differences. In the example in Figure 1, the manometer contains two fluids: water (density p 995 Kg/m³) and mercury (density pm Kg/m³). The density of blood is p 1,060 Kg/m³. Assume that there is atmospheric pressure at the interface between mercury and air. The interface between mercury and water is at z₁ = 7 cm, the interface between water and blood is at Z2 27 cm, and the tip of the manometer at za 10 cm. Recall that the fluid statics equation is dp/dz-pg 0, when the z axis is taken pointing downwards. a. What is the gauge pressure po at the interface with air, in mmHg? (5 points) b. Calculate the gauge pressure ps at the tip of the manometer, in mmHg. (5 points) N Z37 blood ப Zz Water Mercury Zo 3=0 z Figure 1. Manometer for blood pressure measurement.arrow_forward
- Determine the following for the beam with unknown loading, using the Shear and Bending Diagrams provided in the figures on the right: a. The maximum shear stress experienced by the beam. b. The maximum flexural stress experienced by the beam (Indicate if this is tensile or compressive flexural stress) c. The loading diagram (Indicate the magnitudes of the loading/s. The loads are acting along the plane of symmetry of the section) 20 80 20 十十 SHEAR DIAGRAM x=577.3502692 mm 20 KN 1° 5/3 KN 2° C 2° D A B CROSS SECTION Dimensions are in mm LOADING DIAGRAM ? 120 40 40 A B C D 1000mm 2000mm 1000mm -55/3 KN MB' C D BENDING DIAGRAM MB A B Σ Mcarrow_forwardFind the maximum bending stress in ksi for this beam if it is made from a W16x50 steel shape. If the steel yields at 50 ksi, will the beam support the loads shown without permanently deforming? Confirm the max moment in the beam by drawing the shear and moment diagram. 18 kip-ft 2 kip/ft 9 ftarrow_forwardProblem 4 A propped cantilever beam of flexural rigidity EI and 2EI for parts 1-2 and 2-3, respectively, is subjected to a concentrated load P at point 2. Find: a) Determine the displacement at point 2; b) Determine the rotation at point 3; c) Determine the reaction force and moment at point 1; d) Determine the reaction force at point 3. El 2 P 2 EI 2 Larrow_forward
- Problem 3 15 A W150 x 37 rolled-steel beam is used below. Let P150 kN, L-10 m and E 200 GPa. Find the deflection and slope at each node and each pin or wall reaction. If a software program such Maple or MATLAB issued as part of the solution, a hard copy of the code must be submitted too. 1/2 1/2arrow_forward1. Determine the bearings, azimuths, and lengths of lines AB, BC, CD, and DA for the closed loop traverse data shown below in Table 1. Show calculations. Table 1 Station Northing [ft] Easting [ft] A 1,000 1,000 B 750 1,750 C 1,345 2,255 D 1,567 1,345 2. Compute the bearings of sides BC and CD in Figure 1. Show all work for all angles. A B 70°10' S72°39'W C 94°35' Figure 1 Tt (+) B Darrow_forwardhoph - AT 10x AT 10.076 ht 0.076 0 0-1846112 14884 xh T 1.632m h-4- (1-22) h = 1.022m 14. The 4-ft-diameter cylinder, 4 ft long, is acted upon by water on the left and oil of sp gr 0.800 on the right. Determine (a) the normal force at B if the cylinder weighs 4000 lb and (b) the horizontal force due to oil and water if the oil level drops 1 ft. Solution Water Oil Barrow_forward
arrow_back_ios
SEE MORE QUESTIONS
arrow_forward_ios
Recommended textbooks for you

 Structural Analysis (10th Edition)Civil EngineeringISBN:9780134610672Author:Russell C. HibbelerPublisher:PEARSON
 Principles of Foundation Engineering (MindTap Cou...Civil EngineeringISBN:9781337705028Author:Braja M. Das, Nagaratnam SivakuganPublisher:Cengage Learning
 Fundamentals of Structural AnalysisCivil EngineeringISBN:9780073398006Author:Kenneth M. Leet Emeritus, Chia-Ming Uang, Joel LanningPublisher:McGraw-Hill Education
 Traffic and Highway EngineeringCivil EngineeringISBN:9781305156241Author:Garber, Nicholas J.Publisher:Cengage Learning
Structural Analysis (10th Edition)
Civil Engineering
ISBN:9780134610672
Author:Russell C. Hibbeler
Publisher:PEARSON
Principles of Foundation Engineering (MindTap Cou...
Civil Engineering
ISBN:9781337705028
Author:Braja M. Das, Nagaratnam Sivakugan
Publisher:Cengage Learning
Fundamentals of Structural Analysis
Civil Engineering
ISBN:9780073398006
Author:Kenneth M. Leet Emeritus, Chia-Ming Uang, Joel Lanning
Publisher:McGraw-Hill Education
Traffic and Highway Engineering
Civil Engineering
ISBN:9781305156241
Author:Garber, Nicholas J.
Publisher:Cengage Learning