Financial Accounting
15th Edition
ISBN: 9781337272124
Author: Carl Warren, James M. Reeve, Jonathan Duchac
Publisher: Cengage Learning
expand_more
expand_more
format_list_bulleted
Videos
Textbook Question
Chapter 17, Problem 11PEB
Earnings per share and price-earnings ratio
A company reports the following:
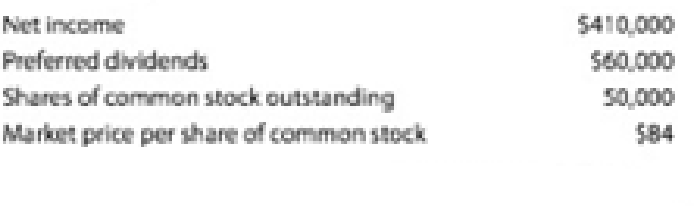
- a. Determine the company’s earnings per share on common stock.
- b. Determine the company’s price-earnings ratio. Round to one decimal place.
Expert Solution & Answer
Want to see the full answer?
Check out a sample textbook solution
Students have asked these similar questions
Can you explain this general accounting question using accurate calculation methods?
Can you explain the correct approach to solve this general accounting question?
Please help me solve this general accounting question using the right accounting principles.
Chapter 17 Solutions
Financial Accounting
Ch. 17 - Prob. 1DQCh. 17 - What is the advantage of using comparative...Ch. 17 - Prob. 3DQCh. 17 - How would the current and quick ratios of a...Ch. 17 - Prob. 5DQCh. 17 - What do the following data, taken from a...Ch. 17 - a. How does the return on total assets differ from...Ch. 17 - Prob. 8DQCh. 17 - Prob. 9DQCh. 17 - Prob. 10DQ
Ch. 17 - Prob. 1PEACh. 17 - Prob. 1PEBCh. 17 - Prob. 2PEACh. 17 - Vertical analysis Income statement information for...Ch. 17 - Prob. 3PEACh. 17 - Prob. 3PEBCh. 17 - Prob. 4PEACh. 17 - Prob. 4PEBCh. 17 - Prob. 5PEACh. 17 - Inventory analysis A company reports the...Ch. 17 - Prob. 6PEACh. 17 - Prob. 6PEBCh. 17 - Times interest earned A company reports the...Ch. 17 - Times interest earned A company reports the...Ch. 17 - Asset turnover A company reports the following:...Ch. 17 - Asset turnover A company reports the following:...Ch. 17 - Prob. 9PEACh. 17 - Prob. 9PEBCh. 17 - Common stockholders' profitability analysis A...Ch. 17 - Common stockholders' profitability analysis A...Ch. 17 - Earnings per share and price-earnings ratio A...Ch. 17 - Earnings per share and price-earnings ratio A...Ch. 17 - Vertical analysis of income statement Revenue and...Ch. 17 - Prob. 2ECh. 17 - Common-sized income statement Revenue and expense...Ch. 17 - Prob. 4ECh. 17 - Prob. 5ECh. 17 - Current position analysis The following data were...Ch. 17 - Prob. 7ECh. 17 - Current position analysis The bond indenture for...Ch. 17 - Accounts receivable analysis The following data...Ch. 17 - Prob. 10ECh. 17 - Inventory analysis The following data were...Ch. 17 - Inventory analysis QT, Inc. and Elppa Computers,...Ch. 17 - Ratio of liabilities to stockholders equity and...Ch. 17 - Prob. 14ECh. 17 - Ratio of liabilities to stockholders equity and...Ch. 17 - Prob. 16ECh. 17 - Profitability ratios The following selected data...Ch. 17 - Profitability ratios Ralph Lauren Corporation...Ch. 17 - Six measures of solvency or profitability The...Ch. 17 - Five measures of solvency or profitability The...Ch. 17 - Earnings per share, price-earnings ratio, dividend...Ch. 17 - Prob. 22ECh. 17 - Earnings per share, discontinued operations The...Ch. 17 - Prob. 24ECh. 17 - Unusual items Explain whether Colston Company...Ch. 17 - Horizontal analysis of income statement For 20Y2,...Ch. 17 - Prob. 2PACh. 17 - Effect of transactions on current position...Ch. 17 - Measures of liquidity, solvency, and profitability...Ch. 17 - Solvency and profitability trend analysis Addai...Ch. 17 - Prob. 1PBCh. 17 - Prob. 2PBCh. 17 - Effect of transactions on current position...Ch. 17 - Prob. 4PBCh. 17 - Solvency and profitability trend analysis Crosby...Ch. 17 - Financial statement analysis The financial...Ch. 17 - Prob. 1CPCh. 17 - Prob. 3CPCh. 17 - Prob. 4CPCh. 17 - Prob. 5CPCh. 17 - The average liabilities, average stockholders'...
Knowledge Booster


Learn more about
Need a deep-dive on the concept behind this application? Look no further. Learn more about this topic, accounting and related others by exploring similar questions and additional content below.Similar questions
- General accountingarrow_forwardCan you help me solve this general accounting question using the correct accounting procedures?arrow_forwardQuestion 5 of 11 Your answer is partially correct. 8.87/14 E ! Here are selected 2027 transactions of Riverbed Company. Jan. 1 June 30 Dec. 31 Retired a piece of machinery that was purchased on January 1, 2017. The machine cost $63,000 and had a useful life of 10 years with no salvage value. Sold a computer that was purchased on January 1, 2024. The computer cost $40,300 and had a useful life of 5 years with no salvage value. The computer was sold for $15,100 cash. Discarded a delivery truck that was purchased on January 1, 2023. The truck cost $33,780. It was depreciated based on a 6-year useful life with a $3,000 salvage value. Journalize all entries required on the above dates, including entries to update depreciation on assets disposed of where applicable. Riverbed Company uses straight-line depreciation. (Assume depreciation is up to date as of December 31, 2026.) (List all debit entries before credit entries. Credit account titles are automatically indented when amount is…arrow_forward
- I need help solving this general accounting question with the proper methodology.arrow_forwardCan you explain the correct methodology to solve this general accounting problem?arrow_forwardwork Question 6 of 11 Pronghorn Company, organized in 2025, has the following transactions related to intangible assets. 1/2/27 Purchased patent (8-year life) $592,000 4/1/27 *Goodwill (indefinite life) 375,000 7/1/27 Acquired 10-year franchise; expiration date 7/1/2037 520,000 9/1/27 Incurred research and development costs 178,000 4.74/14 E *The goodwill resulted from the purchase of a small company for cash in the amount of $750,000. At the time of acquisition, the fair value of the assets totaled $1,850,000, and the fair value of the liabilities totaled $1,475,000. (a1) Your answer is partially correct. Prepare the necessary entries to record these intangibles. All costs incurred were for cash. Make the adjusting entries as of December 31, 2027, recording any necessary amortization and reflecting all balances accurately as of that date. (List all debit entries before credit entries. Credit account titles are automatically indented when amount is entered. Do not indent manually.…arrow_forward
arrow_back_ios
SEE MORE QUESTIONS
arrow_forward_ios
Recommended textbooks for you
 Managerial AccountingAccountingISBN:9781337912020Author:Carl Warren, Ph.d. Cma William B. TaylerPublisher:South-Western College Pub
 Financial And Managerial AccountingAccountingISBN:9781337902663Author:WARREN, Carl S.Publisher:Cengage Learning,
 Financial AccountingAccountingISBN:9781337272124Author:Carl Warren, James M. Reeve, Jonathan DuchacPublisher:Cengage Learning
 College Accounting, Chapters 1-27AccountingISBN:9781337794756Author:HEINTZ, James A.Publisher:Cengage Learning,
 Principles of Accounting Volume 1AccountingISBN:9781947172685Author:OpenStaxPublisher:OpenStax College
 Intermediate Accounting: Reporting And AnalysisAccountingISBN:9781337788281Author:James M. Wahlen, Jefferson P. Jones, Donald PagachPublisher:Cengage Learning
Managerial Accounting
Accounting
ISBN:9781337912020
Author:Carl Warren, Ph.d. Cma William B. Tayler
Publisher:South-Western College Pub
Financial And Managerial Accounting
Accounting
ISBN:9781337902663
Author:WARREN, Carl S.
Publisher:Cengage Learning,
Financial Accounting
Accounting
ISBN:9781337272124
Author:Carl Warren, James M. Reeve, Jonathan Duchac
Publisher:Cengage Learning
College Accounting, Chapters 1-27
Accounting
ISBN:9781337794756
Author:HEINTZ, James A.
Publisher:Cengage Learning,
Principles of Accounting Volume 1
Accounting
ISBN:9781947172685
Author:OpenStax
Publisher:OpenStax College
Intermediate Accounting: Reporting And Analysis
Accounting
ISBN:9781337788281
Author:James M. Wahlen, Jefferson P. Jones, Donald Pagach
Publisher:Cengage Learning
Financial ratio analysis; Author: The Finance Storyteller;https://www.youtube.com/watch?v=MTq7HuvoGck;License: Standard Youtube License