Composition diagrams, commonly known as “alpha plots,” are often used to visualize the species in a solution of an acid or base as the pH is varied. The diagram for 0.100 M acetic acid is shown here. The plot shows how the fraction [alpha ( α )] of acetic acid in solution, α = [ C H 3 C O 2 H ] [ C H 3 C O 2 H ] + [ C H 3 C O 2 − ] changes as the pH increases (blue curve). (The red curve shows how the fraction of acetate ion, CH 3 CO 2 − , changes as the pH increases.) Alpha plots are another way of viewing the relative concentrations of acetic acid and acetate ion as a strong base is added to a solution of acetic acid in the course of a titration. (a) Explain why the fraction of acetic acid declines and that of acetate ion increases as the pH increases. (b) Which species predominates at a pH of 4 , acetic acid or acetate ion? What is the situation at a pH of 6? (c) Consider the point where the two lines cross. The fraction of acetic acid in the solution is 0.5, and so is that of acetate ion. That is, the solution is half acid and half conjugate base; their concentrations are equal. At this point, the graph shows the pH is 4.74. Explain why the pH at this point is 4 74.
Composition diagrams, commonly known as “alpha plots,” are often used to visualize the species in a solution of an acid or base as the pH is varied. The diagram for 0.100 M acetic acid is shown here. The plot shows how the fraction [alpha ( α )] of acetic acid in solution, α = [ C H 3 C O 2 H ] [ C H 3 C O 2 H ] + [ C H 3 C O 2 − ] changes as the pH increases (blue curve). (The red curve shows how the fraction of acetate ion, CH 3 CO 2 − , changes as the pH increases.) Alpha plots are another way of viewing the relative concentrations of acetic acid and acetate ion as a strong base is added to a solution of acetic acid in the course of a titration. (a) Explain why the fraction of acetic acid declines and that of acetate ion increases as the pH increases. (b) Which species predominates at a pH of 4 , acetic acid or acetate ion? What is the situation at a pH of 6? (c) Consider the point where the two lines cross. The fraction of acetic acid in the solution is 0.5, and so is that of acetate ion. That is, the solution is half acid and half conjugate base; their concentrations are equal. At this point, the graph shows the pH is 4.74. Explain why the pH at this point is 4 74.
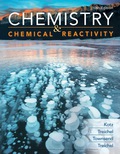
Composition diagrams, commonly known as “alpha plots,” are often used to visualize the species in a solution of an acid or base as the pH is varied. The diagram for 0.100 M acetic acid is shown here.
The plot shows how the fraction [alpha (α)] of acetic acid in solution,
α
=
[
C
H
3
C
O
2
H
]
[
C
H
3
C
O
2
H
]
+
[
C
H
3
C
O
2
−
]
changes as the pH increases (blue curve). (The red curve shows how the fraction of acetate ion, CH3CO2−, changes as the pH increases.) Alpha plots are another way of viewing the relative concentrations of acetic acid and acetate ion as a strong base is added to a solution of acetic acid in the course of a titration.
(a) Explain why the fraction of acetic acid declines and that of acetate ion increases as the pH increases.
(b) Which species predominates at a pH of 4, acetic acid or acetate ion? What is the situation at a pH of 6?
(c) Consider the point where the two lines cross. The fraction of acetic acid in the solution is 0.5, and so is that of acetate ion. That is, the solution is half acid and half conjugate base; their concentrations are equal. At this point, the graph shows the pH is 4.74. Explain why the pH at this point is 4 74.
in the scope of the SCH4U course! please show all steps as im still learning how to format my answers in the format given, thank you!
help me solve this HW
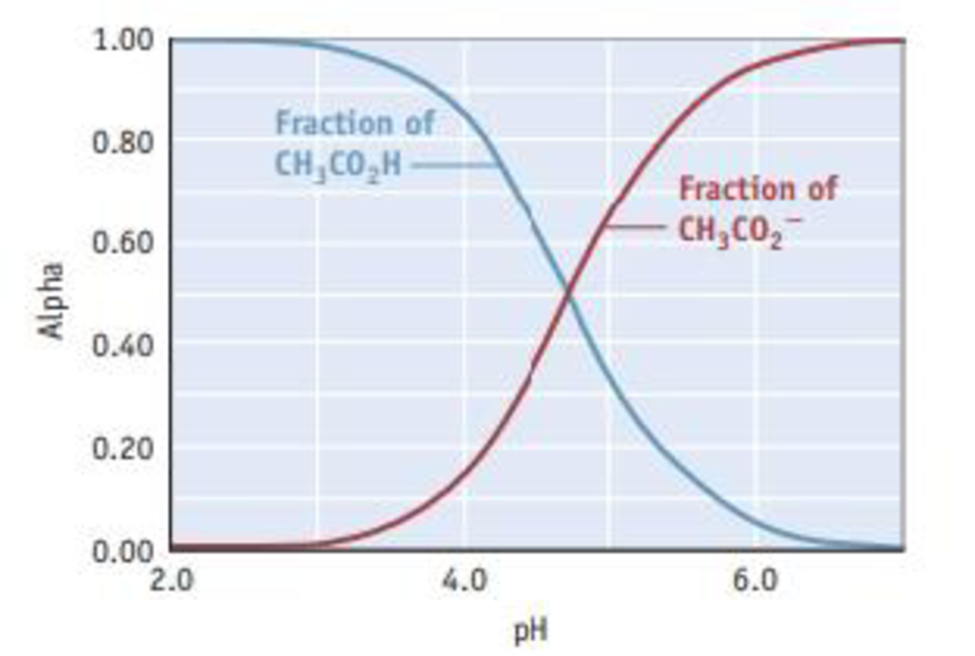
Molecules of the form AH2 can exist in two potential geometries: linear or bent. Construct molecular orbital diagrams for linear and bent CH2. Identify the relevant point group, include all of the appropriate symmetry labels and pictures, and fill in the electrons. Which geometry would you predict to be more stable, and why? (Please draw out the diagram and explain)
Need a deep-dive on the concept behind this application? Look no further. Learn more about this topic, chemistry and related others by exploring similar questions and additional content below.
Author:Steven D. Gammon, Ebbing, Darrell Ebbing, Steven D., Darrell; Gammon, Darrell Ebbing; Steven D. Gammon, Darrell D.; Gammon, Ebbing; Steven D. Gammon; Darrell
Author:Steven D. Gammon, Ebbing, Darrell Ebbing, Steven D., Darrell; Gammon, Darrell Ebbing; Steven D. Gammon, Darrell D.; Gammon, Ebbing; Steven D. Gammon; Darrell


 Chemistry & Chemical ReactivityChemistryISBN:9781337399074Author:John C. Kotz, Paul M. Treichel, John Townsend, David TreichelPublisher:Cengage Learning
 Chemistry & Chemical ReactivityChemistryISBN:9781133949640Author:John C. Kotz, Paul M. Treichel, John Townsend, David TreichelPublisher:Cengage Learning
 General Chemistry - Standalone book (MindTap Cour...ChemistryISBN:9781305580343Author:Steven D. Gammon, Ebbing, Darrell Ebbing, Steven D., Darrell; Gammon, Darrell Ebbing; Steven D. Gammon, Darrell D.; Gammon, Ebbing; Steven D. Gammon; DarrellPublisher:Cengage Learning
 Chemistry: Principles and PracticeChemistryISBN:9780534420123Author:Daniel L. Reger, Scott R. Goode, David W. Ball, Edward MercerPublisher:Cengage Learning
 General, Organic, and Biological ChemistryChemistryISBN:9781285853918Author:H. Stephen StokerPublisher:Cengage Learning
 Chemistry: Principles and ReactionsChemistryISBN:9781305079373Author:William L. Masterton, Cecile N. HurleyPublisher:Cengage Learning