The variables that are plotted on a hydrograph and the indication of such graph.
Answer to Problem 1BYL
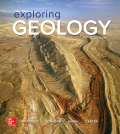
A hydrograph is a graph that shows the volume of discharge over time. It provides information about a river and the area it drains. The variables plotted in a hydrograph are discharge and time. Discharge (Q) is the volume of water that flows in a given amount of time. It can be calculated by multiplying the cross-sectional area of a stream with the flow velocity of the stream. The variables following a storm are plotted on a hydrograph as shown below:
Explanation of Solution
A hydrograph is a graph that shows the volume of discharge over time. The above hydrograph displays the increased discharge that has decreased over time in response to a storm. The shape of the hydrograph indicates the response of a river to precipitation and thereby provides valuable information regarding a river and the region it drains.
The variables that are plotted in a hydrograph are discharge and time. Discharge is the volume of water that flows in a given amount of time. It has units of cubic meters per second or m3/s. Discharge is calculated by the multiplication of the cross-sectional area of the stream by the velocity of the flow. It is denoted by the letter ‘Q’. The formula for calculating discharge is expressed below:
Want to see more full solutions like this?
Chapter 16 Solutions
EBK EXPLORING GEOLOGY

- what are your thoughts on the critical importance of soil management and its impact on agricultural productivity and environmental health, and role of conservation tillage. write in first personarrow_forwardFive arguments that the Water Bottle Bill was passed as a means of "revenue" enhancement In developing your arguments you should start at the website of the Connecticut State Library which contains the history of all legislation passed by the Connecticut Legislature http://ctstatelibrary.org/leghistory_ to gather the information for your arguments. use referencesarrow_forwardDescribe the importance of recycling household solid wastesarrow_forward
- Why is food waste a growing concern? Describe how some communities are addressing the food waste issue.arrow_forwardDescribe examples of source reductionarrow_forwardIncineration of solid waste is controversial. Do you support solid waste incineration in general?Would you support an incineration facility in your neighborhood?arrow_forward
- Describe why electronic waste is becoming a major problem.arrow_forwardHow does Gateway Community College or Norwalk, CT deal with solid waste? Can solid waste production be limited at your institution or city? How? What barriers exist that might make it difficult to limit solid waste production?arrow_forwardIt is possible to have a high standard of living, as in North America and Western Europe, and not produce large amounts of solid waste. How?arrow_forward
 Applications and Investigations in Earth Science ...Earth ScienceISBN:9780134746241Author:Edward J. Tarbuck, Frederick K. Lutgens, Dennis G. TasaPublisher:PEARSON
 Exercises for Weather & Climate (9th Edition)Earth ScienceISBN:9780134041360Author:Greg CarbonePublisher:PEARSON
 Environmental ScienceEarth ScienceISBN:9781260153125Author:William P Cunningham Prof., Mary Ann Cunningham ProfessorPublisher:McGraw-Hill Education
 Earth Science (15th Edition)Earth ScienceISBN:9780134543536Author:Edward J. Tarbuck, Frederick K. Lutgens, Dennis G. TasaPublisher:PEARSON
 Environmental Science (MindTap Course List)Earth ScienceISBN:9781337569613Author:G. Tyler Miller, Scott SpoolmanPublisher:Cengage Learning
 Physical GeologyEarth ScienceISBN:9781259916823Author:Plummer, Charles C., CARLSON, Diane H., Hammersley, LisaPublisher:Mcgraw-hill Education,