1(a)
Determine return on total assets for five years (20Y4 to 20Y8).
1(a)
Explanation of Solution
Financial Ratios: Financial ratios are the metrics used to evaluate the liquidity, capabilities, profitability, and overall performance of a company.
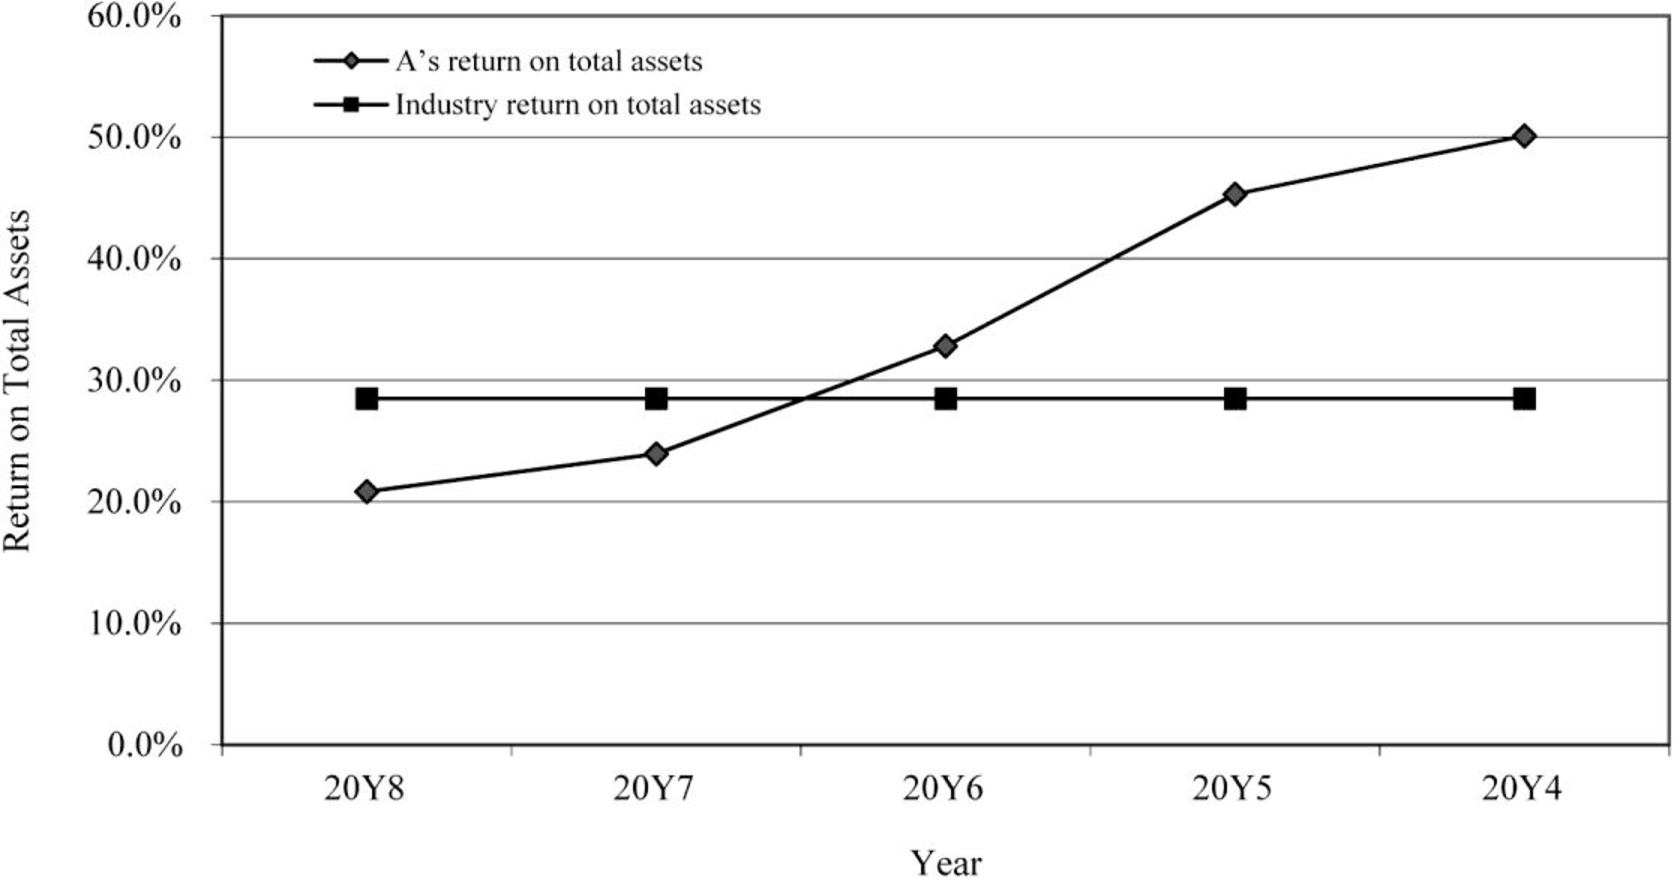
Determine return on total assets for five years (20Y4 to 20Y8).
Return on assets determines the particular company’s overall earning power. It is determined by dividing sum of net income and interest expense and average total assets.
Formula:
1(b)
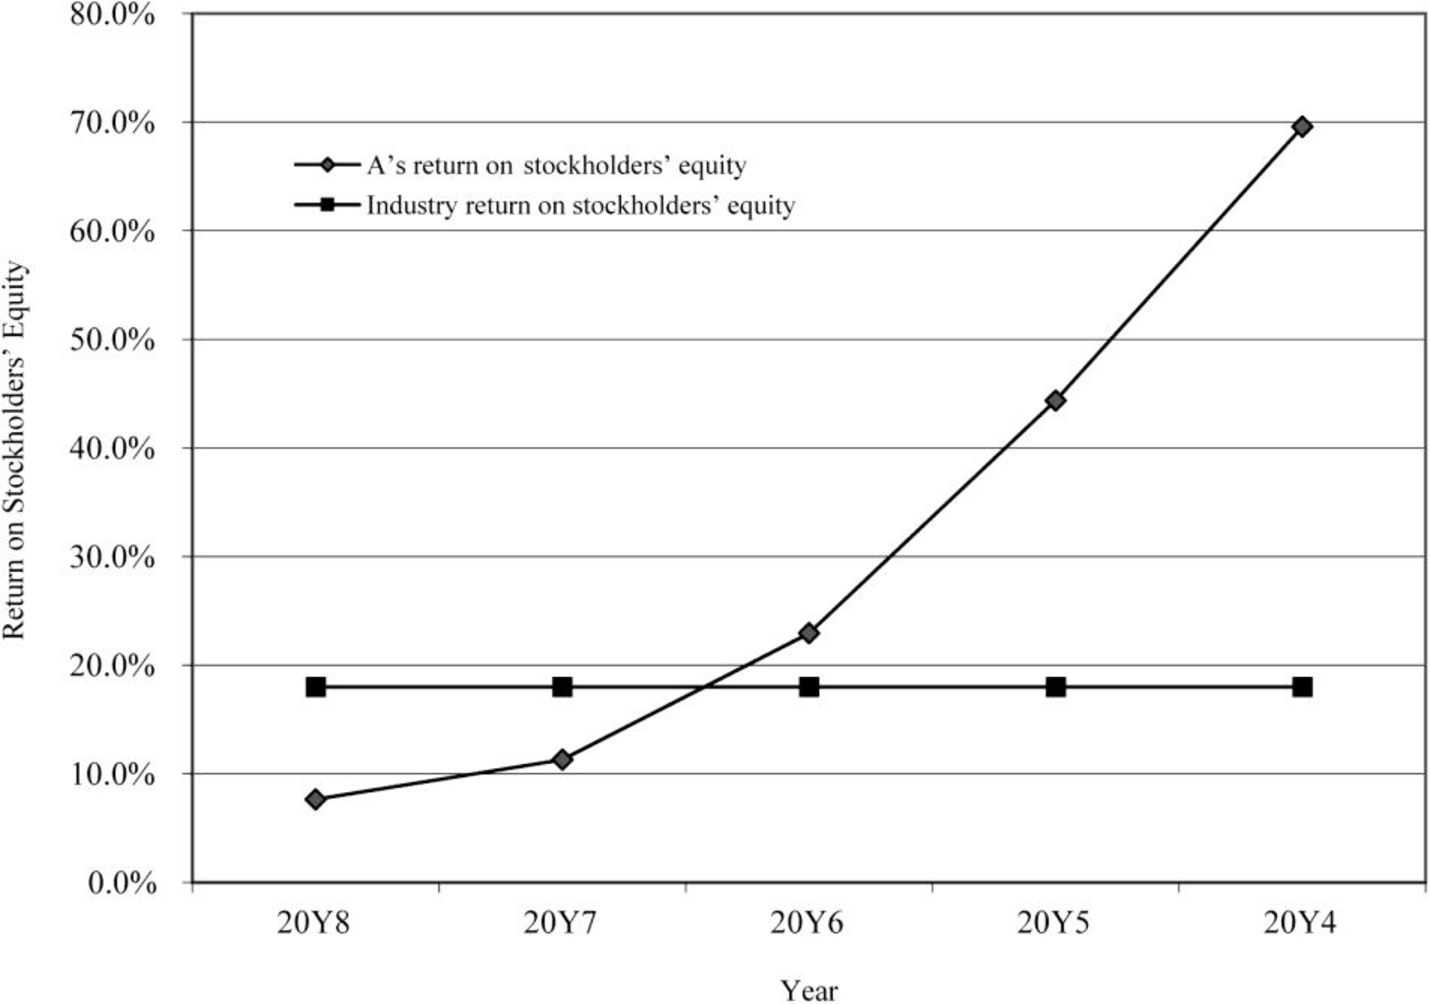
Determine return on
1(b)
Explanation of Solution
Formula:
1(c)
Determine times interest earned ratio for five years.
1(c)
Explanation of Solution
Times interest earned ratio for five years
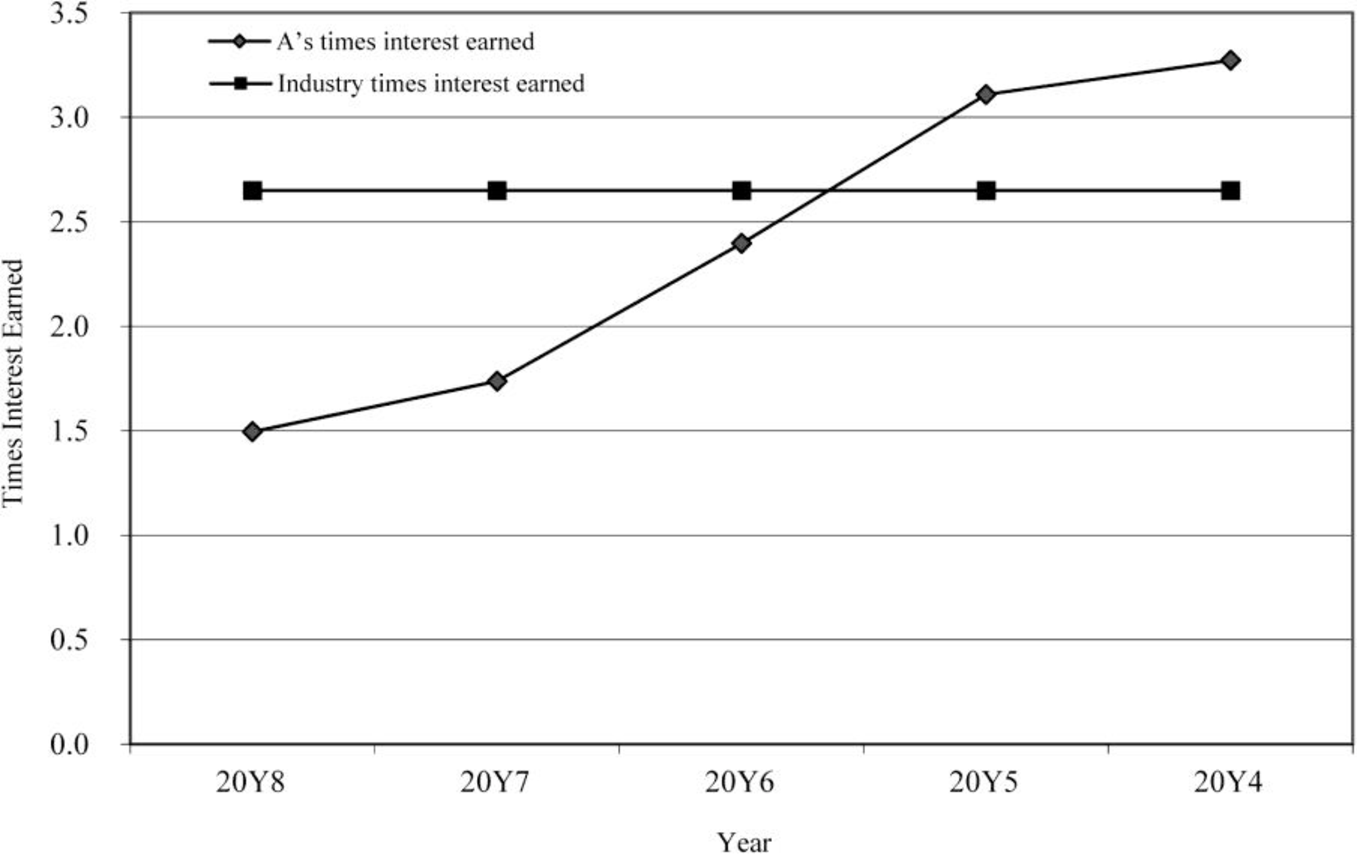
Times interest earned ratio quantifies the number of times the earnings before interest and taxes can pay the interest expense. First, determine the sum of income before income tax and interest expense. Then, divide the sum by interest expense.
Formula:
1(d)
Determine ratio of liabilities to stockholders’ equity for five years (20Y4 to 20Y8).
1(d)
Explanation of Solution
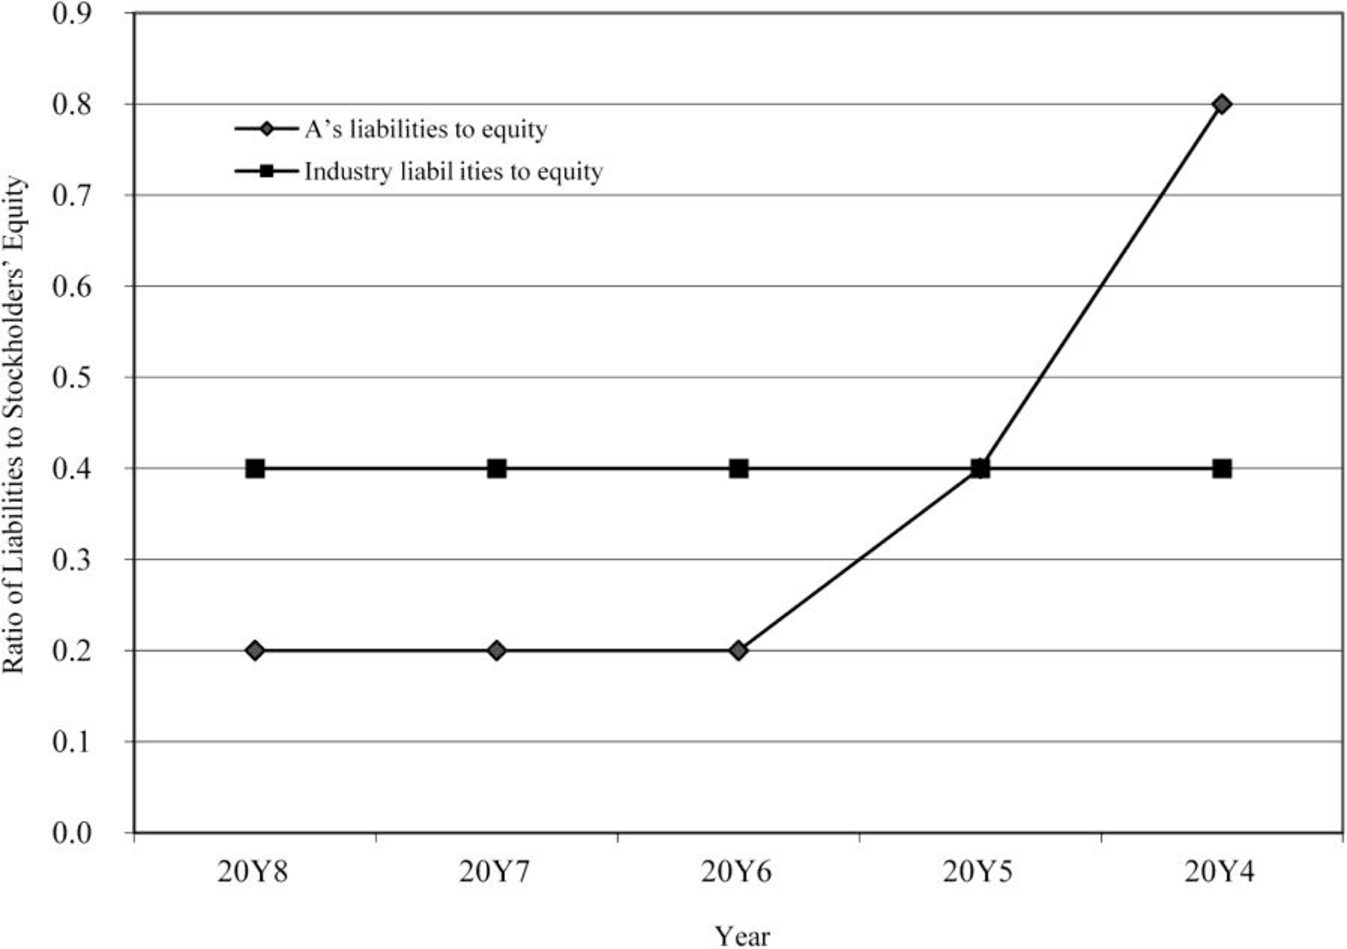
Ratio of liabilities to stockholders’ equity is determined by dividing liabilities and stockholders’ equity. Liabilities are determined as the difference between ending balance of assets and stockholders’ equity.
Formula:
Display the determined ratios in a graph.
Explanation of Solution
Return on total assets

Figure (1)
Return on stockholders’ equity

Figure (2)
Times interest earned ratio

Figure (3)
Ratio of liabilities to stockholders’ equity

Figure (4)
2.
Prepare analysis of graphs.
2.
Explanation of Solution
Analysis:
- • The return on total assets and return on stockholders’ equity is negative trend for the last five years. These measures have moved below the industry average. The reason behind this might be due to decline in the amount of earnings earned.
- • The use of debt is very evident from the ratio of liabilities to stockholders’ equity and it is in the declining pace.
- • The level of debt has been relative to the equity and has improved in the five years.
- • The times interest earned ratio is below the industry average.
Want to see more full solutions like this?
Chapter 16 Solutions
Bundle: Managerial Accounting, 15th + Cengagenowv2, 1 Term Printed Access Card
- A trial balance will balance even if A. a journal entry to record the purchase of equipment for cash of $52100 is not posted. B. a $13100 cash dividend is debited to dividends for $13100 and credited to cash for $1310. C. a $510 collection on accounts receivable is credited to accounts receivable for $510 without a corresponding debit. D. a purchase of supplies for $595 on account is debited to supplies for $595 and credited to accounts payable for $559.arrow_forwardEquipment costing $15200 is purchased by paying $3800 cash and signing a note payable for the remainder. The journal entry to record this transaction should include a credit to Notes Payable. credit to Notes Receivable. credit to Equipment. debit to Cash.arrow_forwardAt December 1, 2025, a company's Accounts Receivable balance was $20160. During December, the company had credit sales of $54000 and collected accounts receivable of $43200. At December 31, 2025, the Accounts Receivable balance is A. $30960 debit. B. $30960 credit. C. $74160 debit. D. $20160 debit.arrow_forward
- Whispering Winds Corp.'s trial balance at the end of its first month of operations reported the following accounts and amounts with normal balances: Cash $14720 Prepaid insurance 460 Accounts receivable 2300 Accounts payable 1840 Notes payable 2760 Common stock 4600 Dividends 460 Revenues 20240 Expenses 11500 Total credits on Whispering Winds Corp's trial balance are A. $28980. B. $30360. C. $29900. D. $29440arrow_forwardSwifty Corporation's trial balance reported the following normal balances at the end of its first year: Cash $14440 Prepaid insurance 530 Accounts receivable 2660 Accounts payable 2130 Notes payable 3190 Common stock 4100 Dividends 530 Revenues 22040 Expenses 13300 What amount did Swifty Corporation's trial balance show as total credits? A. $31460 B. $32520 C. $30930 D. $31990arrow_forwardMonty Inc., a major retailer of high-end office furniture, operates several stores and is a publicly traded company. The company is currently preparing its statement of cash flows. The comparative statement of financial position and income statement for Monty as at May 31, 2020, are as The following is additional information about transactions during the year ended May 31, 2020 for Monty Inc., which follows IFRS. Plant assets costing $69,000 were purchased by paying $47,000 in cash and issuing 5,000 common shares. In order to supplement its cash, Monty issued 4,000 additional common shares. Cash dividends of $35,000 were declered and paid at the end of the fiscal year. create direct method cash flow statement, show your workarrow_forward
- Following is additional information about transactiona during the year ended May 31, 2020 for Monty Inc., which follows IFRS. Plant assets costing $69,000 were purchased by paying $47,000 in cash and issuing 5,000 common shares. In order to supplement iRs cash, Monty Issued 4,000 additional common shares. Cash dividends of $35,000 were declared and paid at the end of the fiscal year. PRepare a direct Method Cash FLow using the format.arrow_forwardmake a trail balancearrow_forwardOn July 31, 2025, the general ledger of Cullumber Legal Services Inc. showed the following balances: Cash $4,960, Accounts Receivable $1,860, Supplies $620, Equipment $6,200, Accounts Payable $5,080, Common Stock $4,340, and Retained Earnings $4,220. During August, the following transactions occurred. Aug. 3 5 Collected $1,490 of accounts receivable due from customers. Received $1,610 cash for issuing common stock to new investors. 6 Paid $3,350 cash on accounts payable. 7 Performed legal services of $8,060, of which $3,720 was collected in cash and the remainder was due on account. 2 2 2 2 2 12 Purchased additional equipment for $1,490, paying $500 in cash and the balance on account. 14 Paid salaries $4,340, rent $1,120, and advertising expenses $340 for the month of August. 18 20 24 26 27 Collected the balance for the services performed on August 7. Paid cash dividend of $620 to stockholders. Billed a client $1,240 for legal services performed. Received $2,480 from Laurentian Bank;…arrow_forward
 Managerial AccountingAccountingISBN:9781337912020Author:Carl Warren, Ph.d. Cma William B. TaylerPublisher:South-Western College Pub
 Managerial Accounting: The Cornerstone of Busines...AccountingISBN:9781337115773Author:Maryanne M. Mowen, Don R. Hansen, Dan L. HeitgerPublisher:Cengage Learning
 Financial AccountingAccountingISBN:9781337272124Author:Carl Warren, James M. Reeve, Jonathan DuchacPublisher:Cengage Learning
 College Accounting, Chapters 1-27AccountingISBN:9781337794756Author:HEINTZ, James A.Publisher:Cengage Learning,
 Financial AccountingAccountingISBN:9781305088436Author:Carl Warren, Jim Reeve, Jonathan DuchacPublisher:Cengage Learning
 Financial Accounting: The Impact on Decision Make...AccountingISBN:9781305654174Author:Gary A. Porter, Curtis L. NortonPublisher:Cengage Learning


