
Concept explainers
Videos
a.
Obtain the
State whether it can be concluded that there is a positive association between the rankings of number of wins and total team salary.
a.
Answer to Problem 42DA
The correlation between the rankings of the number of wins and total team salary is 0.727.
The conclusion is that there is evidence that there is a positive association between the number of wins and total team salary.
Explanation of Solution
Here, d is the difference between ranks of each pair.
n is the number of paired observations.
Step-by-step procedure to obtain correlation using MINITAB is given below:
- Select Stat > Basic Statistics > Correlation.
- In Variables, select Wins, and Team salary from the box on the left.
- In drop down box, select Spearman Rho.
- Click OK.
Output obtained using MINITAB is given below:
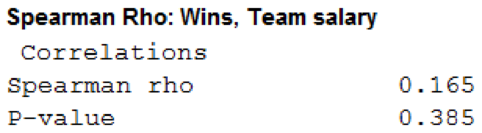
The rank correlation value of 0.165 reveals that there is a slight
The test hypothesis is given as follows:
Null hypothesis:
Alternative hypothesis:
If the
Hypothesis test for rank correlation:
Degrees of freedom:
Decision rule:
- If
- Otherwise, fail to reject the null hypothesis.
In this context, the critical value
The test statistic will be obtained as follows:
Substitute
Conclusion:
Here, the test statistic is less than the critical value.
Therefore, by the decision rule, fail to reject the null hypothesis.
Therefore, there is no evidence to support the claim that there is a positive association between the rankings of the number of wins and total team salary.
b.
State whether there is a difference between two populations.
b.
Answer to Problem 42DA
There is no difference between two populations.
Explanation of Solution
In this context, 1st population has 15 observations and 2nd population has 15 observations and the assumed significance level is 0.05.
The test hypothesis is given as follows:
Null hypothesis:
Alternative hypothesis:
Decision rule:
- If
- Otherwise, fail to reject the null hypothesis.
In this context, the critical value for
The test statistic will be obtained under the following two categories:
Here,
W is the sum of ranks from the first population.
The table represents the ranks for the two populations:
| American | Rank | National | Rank |
| 118.9 | 18 | 65.8 | 1 |
| 168.7 | 26 | 89.6 | 8 |
| 110.7 | 13 | 117.2 | 16 |
| 87.7 | 7 | 117.7 | 17 |
| 172.8 | 27 | 98.3 | 9 |
| 69.1 | 2 | 230.4 | 30 |
| 112.9 | 14 | 84.6 | 5 |
| 146.4 | 24 | 98.7 | 10 |
| 108.3 | 12 | 100.1 | 11 |
| 213.5 | 29 | 133 | 22 |
| 80.8 | 4 | 85.9 | 6 |
| 123.2 | 20 | 126.6 | 21 |
| 74.8 | 3 | 166.5 | 25 |
| 144.8 | 23 | 120.3 | 19 |
| 116.4 | 15 | 174.5 | 28 |
The sum of the ranks from the first population is as follows:
The test statistic will be obtained as given below:
Substitute W as 237, n1 as 15, and n2 as 15.
Conclusion:
Here, the test statistic is greater than the critical value
Therefore, by the decision rule, fail to reject the null hypothesis.
Therefore, there is no evidence to support the claim that the two populations are different.
c.
Obtain the correlation between the rankings of the attendance and total team salary.
State whether it can be concluded that there is a positive association between the rankings of the attendance and total team salary.
c.
Answer to Problem 42DA
The correlation between the rankings of the attendance and total team salary is 0.727.
The conclusion is that there is evidence that there is a association between the number of attendance and total team salary.
Explanation of Solution
Step-by-step procedure to obtain correlation using MINITAB is given below:
- Select Stat > Basic Statistics > Correlation.
- In Variables, select Attendance, and Team salary from the box on the left.
- In drop down box, select Spearman Rho.
- Click OK.
Output obtained using MINITAB is given below:
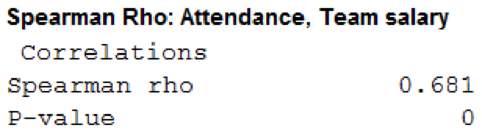
The rank correlation value of 0.681 reveals that there is a positive correlation between rankings of the number of attendance and total team salary.
The test hypothesis is given as follows:
Null hypothesis:
Alternative hypothesis:
If the sample size is greater than 10, then the sampling distribution of
Hypothesis test for rank correlation:
Degrees of freedom:
Decision rule:
- If
- Otherwise, fail to reject the null hypothesis.
In this context, the critical value
The test statistic will be obtained as follows:
Substitute
Conclusion:
Here, the test statistic is greater than the critical value.
Therefore, by the decision rule, reject the null hypothesis.
Therefore, there is enough evidence to support the claim that there is an association between the rankings of the number of attendance and total team salary.
Want to see more full solutions like this?
Chapter 16 Solutions
Gen Combo Ll Statistical Techniques In Business And Economics; Connect Ac


- Name Harvard University California Institute of Technology Massachusetts Institute of Technology Stanford University Princeton University University of Cambridge University of Oxford University of California, Berkeley Imperial College London Yale University University of California, Los Angeles University of Chicago Johns Hopkins University Cornell University ETH Zurich University of Michigan University of Toronto Columbia University University of Pennsylvania Carnegie Mellon University University of Hong Kong University College London University of Washington Duke University Northwestern University University of Tokyo Georgia Institute of Technology Pohang University of Science and Technology University of California, Santa Barbara University of British Columbia University of North Carolina at Chapel Hill University of California, San Diego University of Illinois at Urbana-Champaign National University of Singapore…arrow_forwardA company found that the daily sales revenue of its flagship product follows a normal distribution with a mean of $4500 and a standard deviation of $450. The company defines a "high-sales day" that is, any day with sales exceeding $4800. please provide a step by step on how to get the answers in excel Q: What percentage of days can the company expect to have "high-sales days" or sales greater than $4800? Q: What is the sales revenue threshold for the bottom 10% of days? (please note that 10% refers to the probability/area under bell curve towards the lower tail of bell curve) Provide answers in the yellow cellsarrow_forwardFind the critical value for a left-tailed test using the F distribution with a 0.025, degrees of freedom in the numerator=12, and degrees of freedom in the denominator = 50. A portion of the table of critical values of the F-distribution is provided. Click the icon to view the partial table of critical values of the F-distribution. What is the critical value? (Round to two decimal places as needed.)arrow_forward
- A retail store manager claims that the average daily sales of the store are $1,500. You aim to test whether the actual average daily sales differ significantly from this claimed value. You can provide your answer by inserting a text box and the answer must include: Null hypothesis, Alternative hypothesis, Show answer (output table/summary table), and Conclusion based on the P value. Showing the calculation is a must. If calculation is missing,so please provide a step by step on the answers Numerical answers in the yellow cellsarrow_forwardShow all workarrow_forwardShow all workarrow_forward
 Glencoe Algebra 1, Student Edition, 9780079039897...AlgebraISBN:9780079039897Author:CarterPublisher:McGraw Hill
 Holt Mcdougal Larson Pre-algebra: Student Edition...AlgebraISBN:9780547587776Author:HOLT MCDOUGALPublisher:HOLT MCDOUGAL
 Big Ideas Math A Bridge To Success Algebra 1: Stu...AlgebraISBN:9781680331141Author:HOUGHTON MIFFLIN HARCOURTPublisher:Houghton Mifflin Harcourt