
Concept explainers
Videos
A sample containing years to maturity and yield (%) for 40 corporate bonds is contained in the data file named CorporateBonds (Barron’s, April 2, 2012).
- a. Develop a
scatter diagram of the data using x = years to maturity as the independent variable. Does a simple linear regression model appear to be appropriate? - b. Develop an estimated regression equation with x = years to maturity and x2 as the independent variables.
- c. As an alternative to fitting a second-order model, fit a model using the natural logarithm of price as the independent variable; that is,
a.
Construct a scatter diagram of the data using
Decide whether a simple linear regression model appears to be appropriate.
Answer to Problem 26SE
A simple linear regression model does not appear to be appropriate.
Explanation of Solution
Calculation:
The given information is about the yield (%) of 40 corporate bonds and their respective years to maturity.
Scatterplot:
Software procedure:
Step-by-step procedure to draw scatter diagram using EXCEL software:
- Open EXCEL file CorporateBonds.
- Select the two variables yield and years with labels.
- Go to Insert > Scatterplot.
- Click OK.
The scatter diagram of the data using EXCEL software is given below:
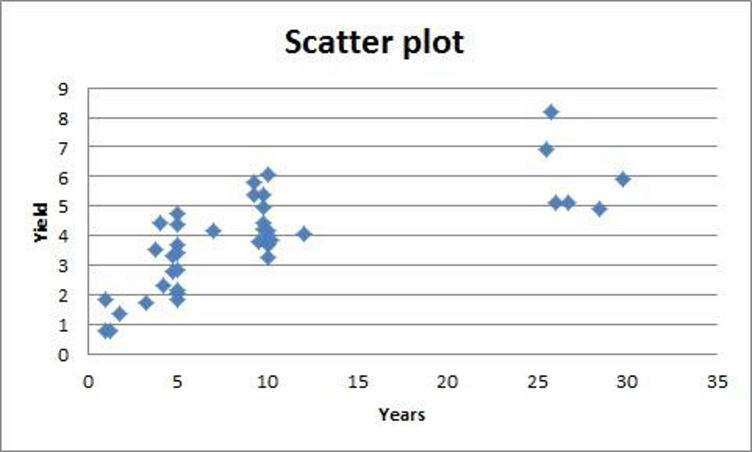
Observation:
The scatterplot shows a gradual increase in the yield at a decreasing rate, with increase in years up to 25. After this, there is a reduction in the values of yield. That is, the scatterplot shows a curvilinear relationship between the variables. Therefore, a simple linear regression model does not appear to be appropriate.
b.
Develop an estimated multiple regression equation with
Answer to Problem 26SE
The estimated multiple regression equation with
Explanation of Solution
Calculation:
Square transformation:
Software procedure:
Step-by-step procedure to make square transformation using EXCEL software:
- Open EXCEL file CorporateBonds.
- Copy the variable Years in column D.
- Create a new variable using the command ‘=(Years)^2’ in column E.
The squared variable is stored in column E.
Regression:
Software procedure:
Step-by-step procedure to obtain the regression equation using EXCEL software:
- Select Data > Data Analysis > Regression.
- Click OK.
- Under Input Y Range, enter $C$1:$C$41.
- Under Input X Range, enter $D$1:$E$41.
- Click the box of Labels.
- Under Output Range, enter $J$1.
- Click OK.
The output obtained using EXCEL software is given below:
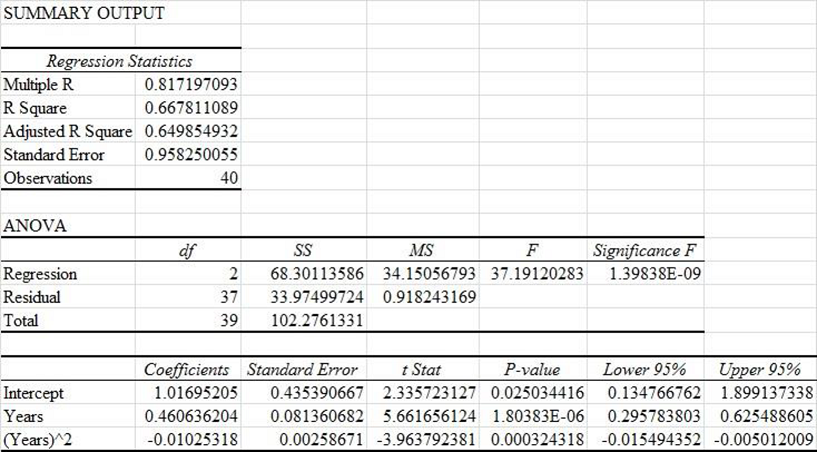
From the output, the estimated multiple regression equation with
c.
Develop an estimated multiple regression equation using the natural logarithm of years as the independent variable.
Explain whether the current regression provides a better fit than the estimated regression developed in Part b.
Answer to Problem 26SE
The estimated multiple regression equation using the natural logarithm of years as the independent variable is as follows:
The estimated regression using the natural logarithm of x provides a better fit than the estimated regression developed in Part (b).
Explanation of Solution
Calculation:
Logarithmic transformation:
Software procedure:
Step-by-step procedure to make logarithmic transformation using EXCEL software:
- Open EXCEL file CorporateBonds.
- Create a new variable using the command ‘=ln(Years)’ in column F.
The logarithm of the variable is stored in column F.
Regression:
Software procedure:
Step-by-step procedure to obtain the regression equation using EXCEL software:
- Select Data > Data Analysis > Regression.
- Click OK.
- Under Input Y Range, enter $C$1:$C$41.
- Under Input X Range, enter $F$1:$F$41.
- Click the box of Labels.
- Under Output Range, enter $J$1.
- Click OK.
The output obtained using EXCEL software is given below:
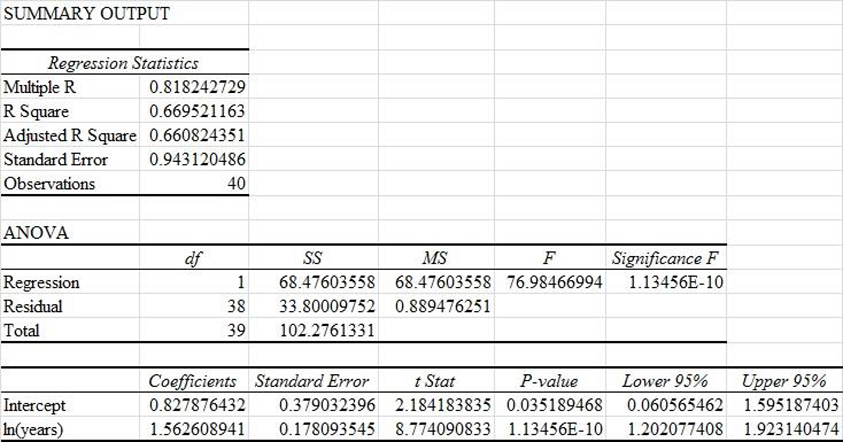
From the output, the estimated multiple regression equation using the natural logarithm of years as the independent variable is as follows:
Adjusted-
The adjusted
The value of adjusted
The value of adjusted
Evidently, the current regression equation effectively explains more of the variation of the response variable than the second regression equation.
Thus, the estimated regression using the natural logarithm of x provides a better fit than the estimated regression developed in Part (b).
Want to see more full solutions like this?
Chapter 16 Solutions
Modern Business Statistics with Microsoft Office Excel (with XLSTAT Education Edition Printed Access Card) (MindTap Course List)


- Show all workarrow_forwardplease find the answers for the yellows boxes using the information and the picture belowarrow_forwardA marketing agency wants to determine whether different advertising platforms generate significantly different levels of customer engagement. The agency measures the average number of daily clicks on ads for three platforms: Social Media, Search Engines, and Email Campaigns. The agency collects data on daily clicks for each platform over a 10-day period and wants to test whether there is a statistically significant difference in the mean number of daily clicks among these platforms. Conduct ANOVA test. You can provide your answer by inserting a text box and the answer must include: also please provide a step by on getting the answers in excel Null hypothesis, Alternative hypothesis, Show answer (output table/summary table), and Conclusion based on the P value.arrow_forward
- A company found that the daily sales revenue of its flagship product follows a normal distribution with a mean of $4500 and a standard deviation of $450. The company defines a "high-sales day" that is, any day with sales exceeding $4800. please provide a step by step on how to get the answers Q: What percentage of days can the company expect to have "high-sales days" or sales greater than $4800? Q: What is the sales revenue threshold for the bottom 10% of days? (please note that 10% refers to the probability/area under bell curve towards the lower tail of bell curve) Provide answers in the yellow cellsarrow_forwardBusiness Discussarrow_forwardThe following data represent total ventilation measured in liters of air per minute per square meter of body area for two independent (and randomly chosen) samples. Analyze these data using the appropriate non-parametric hypothesis testarrow_forward
 Functions and Change: A Modeling Approach to Coll...AlgebraISBN:9781337111348Author:Bruce Crauder, Benny Evans, Alan NoellPublisher:Cengage Learning
 Glencoe Algebra 1, Student Edition, 9780079039897...AlgebraISBN:9780079039897Author:CarterPublisher:McGraw Hill
 Big Ideas Math A Bridge To Success Algebra 1: Stu...AlgebraISBN:9781680331141Author:HOUGHTON MIFFLIN HARCOURTPublisher:Houghton Mifflin Harcourt
 College AlgebraAlgebraISBN:9781305115545Author:James Stewart, Lothar Redlin, Saleem WatsonPublisher:Cengage Learning
 Algebra and Trigonometry (MindTap Course List)AlgebraISBN:9781305071742Author:James Stewart, Lothar Redlin, Saleem WatsonPublisher:Cengage Learning