
Concept explainers
Videos
Problem 10-21A Using
Daryl Kearns saved $240,000 during the 30 years that he worked for a major corporation. Now he has retired at the age of 60 and has begun to draw a comfortable pension check every month. He wants to ensure the financial security of his retirement by investing his savings wisely and is currently considering two investment opportunities. Both investments require an initial payment of $160,000. The following table presents the estimated
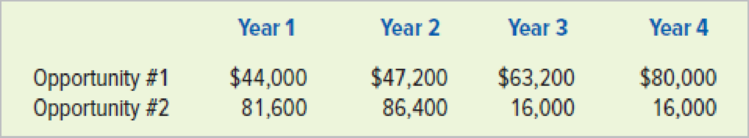
Mr. Kearns decides to use his past average return on mutual fund investments as the discount rate; it is 8 percent.
Required
Round your computation to two decimal points.
- a. Compute the net present value of each opportunity. Which should Mr. Kearns adopt based on the net present value approach?
- b. Compute the payback period for each project. Which should Mr. Kearns adopt based on the payback approach?
- c. Compare the net present value approach with the payback approach. Which method is better in the given circumstances?
a.
Ascertain the net present value of each opportunity, and state whether person K should approve the given project or not.
Explanation of Solution
Net present value method:
Net present value method is the method which is used to compare the initial cash outflow of investment with the present value of its cash inflows. In the net present value, the interest rate is desired by the business based on the net income from the investment, and it is also called as the discounted cash flow method.
Ascertain the net present value of each opportunity, and state whether person K should approve the given project or not as follows:
Opportunity 1:
| Net present value of opportunity 1 | |||
| Year | Net cash flow (A) | Present value of $1 at 8% [from table 1 in appendix ](B) | Present value of net cash flow |
| 1 | $44,000 | 0.925926 | $40,740.74 |
| 2 | $47,200 | 0.857339 | $40,466.40 |
| 3 | $63,200 | 0.793832 | $50,170.18 |
| 4 | $80,000 | 0.735030 | $58,802.40 |
| Total present value of cash flows | $190,179.73 | ||
| Less: Cost of investment | $160,000.00 | ||
| Net present value of the project | $ 30,179.73 | ||
Table (1)
Opportunity 2:
| Net present value of opportunity 2 | |||
| Year | Net cash flow (A) | Present value of $1 at 8% [from table 1 in appendix ](B) | Present value of net cash flow |
| 1 | $81,600 | 0.925926 | $75,555.56 |
| 2 | $86,400 | 0.857339 | $74,074.09 |
| 3 | $16,000 | 0.793832 | $12,701.31 |
| 4 | $16,000 | 0.735030 | $11,760.48 |
| Total present value of cash flows | $174,091.44 | ||
| Less: Cost of investment | $160,000.00 | ||
| Net present value of the project | $14,091.44 | ||
Table (2)
In this case, opportunity 1is better for the investment, because opportunity 1 ($30,179.73) has higher net present value than opportunity 2 ($14,091.44).
b.
Compute the payback period for each project, and state whether person K should approve the given project or not.
Explanation of Solution
Payback period: Payback period is the expected time period which is required to recover the cost of investment. It is one of the capital investment method used by the management to evaluate the proposal of long-term investment (fixed assets) of the business.
Compute the payback period for each project, and state whether person K should approve the given project or not as follows:
Opportunity 1:
| Cash payback period of opportunity 1 | ||
| Years and months | Net cash flows ($) | Cumulative net cash flows ($) |
| 1 | 44,000 | 44,000 |
| 2 | 47,200 | 91,200 |
| 3 | 63,200 | 154,400 |
| 1 month (1) | 5,600 | 160,000 |
Hence, the cash payback period of opportunity 1 is 3 years and 1 month.
Opportunity 2:
| Cash payback period of opportunity 2 | ||
| Year and months | Net cash flows | Cumulative net cash flows |
| 1 | 81,600 | 81,600 |
| 11 months (2) | 78,400 | 160,000 |
Hence, the cash payback period of opportunity 2 is 1 year and 11 months.
In this case, opportunity 2 is better for the investment, because opportunity 2 has shorter payback period than opportunity 1.
Working note:
Calculate the number of months in the cash payback period of opportunity 1:
Calculate the number of months in the cash payback period of opportunity 2:
c.
Compare the net present value approach will the payback approach, and state the method which is better for the given circumstance.
Explanation of Solution
Compare the net present value approach will the payback approach, and state the method which is better for the given circumstance as follows:
The net present value approach represents the net cash flow with consideration of the time value of money, whereas cash payback technique neglects cash flows occurring after the payback period, and it does not use the present value concept (time value of money) in valuing cash flows that are occurring in the different time period. In other word, payback period approach measures the risk of the investment rather than the profitability.
If an investor is very concerned about the risk of an investment, the payback period approach is best for the decision making. Under this circumstance, opportunity 2 is better for the investment.
If an investor is very concerned about the profitability of an investment, the net present value approach is best for the decision making. Under this circumstance, opportunity 1 is better for the investment.
Want to see more full solutions like this?
Chapter 16 Solutions
SURVEY OF ACCOUNT.(LL)-W/ACCESS>CUSTOM<


- Please provide the solution to this financial accounting question using proper accounting principles.arrow_forwardI need help finding the accurate solution to this financial accounting problem with valid methods.arrow_forwardCan you explain this financial accounting question using accurate calculation methods?arrow_forward
- I am looking for help with this financial accounting question using proper accounting standards.arrow_forwardPlease provide the correct answer to this financial accounting problem using accurate calculations.arrow_forwardCan you solve this financial accounting problem with appropriate steps and explanations?arrow_forward
 PFIN (with PFIN Online, 1 term (6 months) Printed...FinanceISBN:9781337117005Author:Randall Billingsley, Lawrence J. Gitman, Michael D. JoehnkPublisher:Cengage Learning
 Pfin (with Mindtap, 1 Term Printed Access Card) (...FinanceISBN:9780357033609Author:Randall Billingsley, Lawrence J. Gitman, Michael D. JoehnkPublisher:Cengage Learning