
The structure stiffness matrix for the frame.
Answer to Problem 16.1P
The structure stiffness matrix for the frame is shown below.
Explanation of Solution
Concept Used:
Write the expression for direction cosine in x-direction.
Here, coordinate of x at near end of the member is
Write the expression for direction cosine in x-direction.
Here, coordinate of y at near end of the member is
Write the global stiffness matrix for the member.
Here, cross-sectional area of the member is
Calculation:
The free body diagram of the frame is shown below.
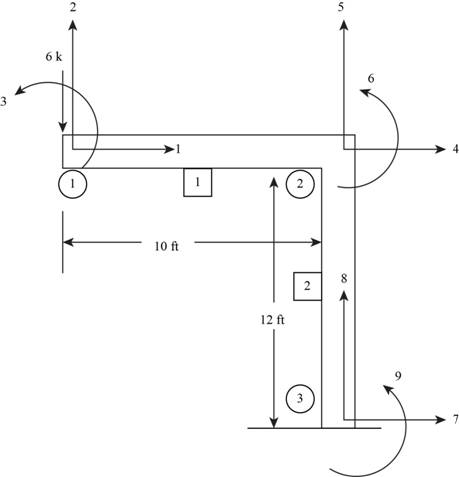
Figure (1)
Consider the member-1.
Calculate direction cosine in x-direction.
Substitute
Calculate direction cosine in y-direction.
Substitute
The stiffness matrix for member-1 is shown below.
Substitute
Calculate the value of
Substitute
Calculate the value of
Substitute
Calculate the value of
Substitute
Calculate the value of
Substitute
Calculate the value of
Substitute
Substitute
Consider the member-2.
Calculate direction cosine in x-direction.
Substitute
Calculate direction cosine in y-direction.
Substitute
The stiffness matrix for member-1 is shown below.
Substitute
Calculate the value of
Substitute
Calculate the value of
Substitute
Calculate the value of
Substitute
Calculate the value of
Substitute
Calculate the value of
Substitute
Substitute
The final matrix of the frame by assembling matrices (III) and (IV) is shown below.
Conclusion:
The structure stiffness matrix for the frame is shown below.
Want to see more full solutions like this?
Chapter 16 Solutions
STRUCTURAL ANAL.W/MOD MASTERING ACCE

- 2. Determine the reactions, and shear and moment diagrams. EI= 50000 kip-ft2[50pts] Note: You can use the virtual work method/ Table to calculate fij terms. A 18 ft B 40 k 6 ft Carrow_forwardbased on the gantt chart shown what is the most appropriate next step to prevent project delay? A) Shift non-critical tasks to make room for Task B B) Reassign the graming worrk to a different subcontractor immediately. C) Extend the project deadline by one week D)Analyze float in adjacent task and consider crashing task Barrow_forwardAccording to the site safety layout what is the biggest potential safety risk? A) PPE Station Located too lose to a heavy equipment zone B) Emergency assemlt point is near the parking lot C)Fire Extingishers are placed every 50 ft. D) Only one site entrance is open for deliveriesarrow_forward
- which method is most effective for controlling costs and tracking budget performance during a construction project? A)SWOT Analysis B)Root Cause Analysis C)Gantt Chart D) Value Stream Mappingarrow_forward9.44 High-speed passenger trains are streamlined to reduce shear force. The cross section of a passenger car of one such train is shown. For a train 81 m long, estimate the shear force (a) for a speed of 81.1 km/hr and (b) for one of 204 km/hr. What power is required for just the shear force at these speeds? These two power calculations will be answers (c) and (d), respectively. Assume T = 10°C and that the boundary layer is tripped at the front of the train. 10 m Problem 9.44arrow_forwardA monitoring program for water flow in an unsaturated soil layer includes sensors to measure the volumetric water content and suction up to a depth of 3 m. The soil is a sand whose hydraulic properties are shown in the figures below. Using the drying curves, draw a quantitatively accurate set of vertical profiles of volumetric water content, pressure head, and total hydraulic head versus depth (with a datum at the base of the soil layer and an elevation head that is positive upward) expected for the following cases:A) The volumetric water content (moisture content) is 10% throughout the profile B) The pressure head is -150 cm throughout the profile C) The total hydraulic head is 100 cm throughout the profile (static no-flow case) Also, report the hydraulic gradient for each case. For parts (a) and (b), calculate the flow rates through the profile. For part (c), calculate the depth to the water table.arrow_forward
- 9.16 Two vertical parallel plates are spaced 0.012 ft apart. If the pressure decreases at a rate of 100 psf/ft in the vertical z direction in the fluid between the plates, what is the maximum fluid velocity in the Z direction? The fluid has a viscosity of 10-3 Ibf s/ft² and a specific gravity of 0.80. .arrow_forwardPlease explain steps using software.arrow_forwardPlease explain steps for using softwarearrow_forward
- Design the reinforced masonry beam in the wall shown below. The wall is to be constructed of fully grouted hollow concrete masonry units in running bond. It is to carry its own weight plus a superimposed dead load of 2.5 kips/ft and a live load of 0.8 kip/ft. Determine the width of the masonry units (by trials), and the amounts of the longitudinal and shear reinforcement required using the strength design method of TMS 402-22. Show the layout of the reinforcements with diagrams. Use fm = 2,000 psi, Grade 60(60 ksi) steel, and Type S Portland cement mortar. Assume that the centroid of the bottom rebar is 3 inches from the bottom face of the beam. ( you may assume that the unit weight of fully grouted concrete masonry is 125 lbs per cubic foot.)arrow_forward6. The easiest method to solve the beam shown in question number 14 is A. Force method B. Slope deflection method C. Moment distribution method D. Virtual work method E. Stiffness matrix method 17. The value of 8 caused by applying CW moment at A equal to 18. A. ML/2E1 B. ML/3E1 C. ML/4E1 D. ML/6EI E. None of the above For the beam shown below, the moment at A kN.m CCW. Assume P= 8 kN equals to ........ A. 20 B. 22.5 C. 25 D. 27.5 E. 30 M L A unlocked joint end pin P P P B A 1m 1m 2m 2m 19. The analysis of indeterminate non sway frames using moment distribution method does not need..... A. Finding stiffness factors of members B. Finding fix end moments C. Using compatibility equations D. Removing redundants E. Cand D 0. The frame shown is kinematically 6 kN/m indeterminate to ................ degree. A, C and D are fixed. E and B are pinned. A. First B. Second C. Third D. Fourth E. None of the above 6 m Sm 7 marrow_forward1. The moment at A using slope deflection method equals to 10 kN ..... kN. m CCW. A. 2.5 B. 5 C. 7.5 D. 10 E. None of the above 2m 2m B 10 kN + 2m + 2m 2. To solve the beam shown using slope deflection method,. ...... unknowns (s) 25 kN 15 kN/m should be selected. A. One B. Two fix C. Three D. Four E. None of the above magnitude of the rotation at B for the me shown using slope deflection method quals to El constant. A. -162/EI B. -162 El C. 40/El D. -40 El E. 0.3 radian B A 3 m 3 m -4 m- 4k/ft roller A fix 18 ft. To solve the beam shown using slope deflection method, should be fix selected as equilibrium equation (s). A. MAB+MBA = 0 B. MAB + MBA 0 and MBC=0 C. MBA+MBC = 0 D. MBA+MBC = 0 and MCB=0 E. None of the above B fix fix 9ft 20 kN/m 80 EN pin 9 m 3 m rollerarrow_forward

 Structural Analysis (10th Edition)Civil EngineeringISBN:9780134610672Author:Russell C. HibbelerPublisher:PEARSON
 Principles of Foundation Engineering (MindTap Cou...Civil EngineeringISBN:9781337705028Author:Braja M. Das, Nagaratnam SivakuganPublisher:Cengage Learning
 Fundamentals of Structural AnalysisCivil EngineeringISBN:9780073398006Author:Kenneth M. Leet Emeritus, Chia-Ming Uang, Joel LanningPublisher:McGraw-Hill Education
 Traffic and Highway EngineeringCivil EngineeringISBN:9781305156241Author:Garber, Nicholas J.Publisher:Cengage Learning