Videos
(Optimal Provision of Public Goods) Using at least two individual consumers, show how the market
the market demand curve is to be derived from individual demand curves for a private goods and for a public good and then introduce the market supply curve and show the optimal level of production.
Concept Introduction:
A demand curve is a graph that shows the change in quantity demanded of a good or service with respect to its price. With change in price the demand also change and it carries an inverse relationship with the price. Market demand refers to the demand of a good in a particular market that adds up to a sum of different individual demands.
Explanation of Solution
Individual demand curves adds up to make a market demand curve for a good. It is a broader term that defines demand of a particular good at a much larger scale.
a. For a private good: Private good refers to the good that needs to be purchased from the private individual and its consumption by one individual prevents it to be consumed from the other individuals.
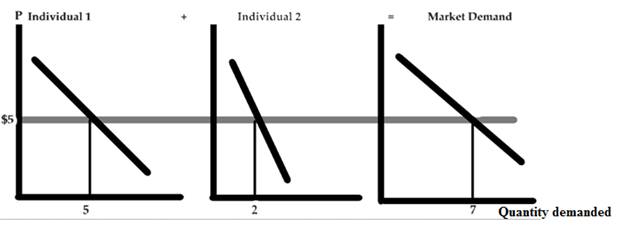
In the above figure there are three curves, where curve 1 is the individual demand curve for a good at price $5 and quantity 5 units. The second curve represents the individual demand curve for the same good at same price but the quantity is 2. The third curve is the market demand curve which is the summation of curve 1 of individual 1 and curve 2 of individual 2 at price $5 same as before. The market demand curve is the summation of curve 1 and curve 2 therefore the quantity for the same is 5 + 2 = 7 units.
b. For public good: A public good is a good which is provided to all the members of the society without profit, it is provided by the government, individual or an organization. The consumption of such good doesn’t affect the consumption for others.
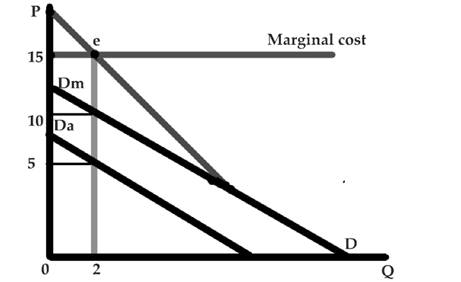
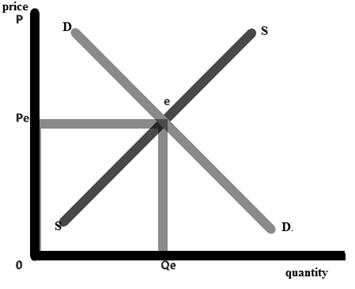
Public good once produced is available to all people and in identical amounts. Hence the demand for the public good is the vertical summation of each individuals demand. The marginal cost here equals the marginal benefits at e where the market demand curve and the marginal cost curve are at equilibrium. The red line on the graph represent the market demand curve and the blue line defines the marginal cost curve. Dm and Da are respectively the two individual demand curves which add up vertically with quantity being constant to make the market demand curve.
The market supply curve is an upward sloping curve which shows a positive relationship between the price and the quantity supplied. The summation of the individuals producers supply makes the market supply curve.
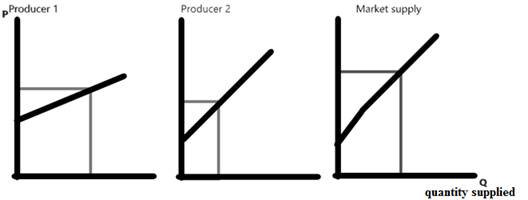
The optimal level of production is the point where the market demand is equal to that of the market supply and that level of intersection is called the market demand.
Want to see more full solutions like this?
Chapter 16 Solutions
ECON MICRO (with ECON MICRO Online, 1 term (6 months) Printed Access Card) (New, Engaging Titles from 4LTR Press)


- 20. Factors 01 pro B. the technological innovations available to companies. A. the laws that regulate manufacturers. C. the resources used to create output D. the waste left over after goods are produced. 21. Table 1.1 shows the tradeoff between different combinations of missile production and home construction, ceteris paribus. Complete the table by calculating the required opportunity costs for both missiles and houses. Then answer the indicated question(s). Combination Number of houses Opportunity cost of houses in Number of missiles terms of missiles J 0 4 K 10,000 3 L 17,000 2 1 M 21,000 0 N 23,000 Opportunity cost of missiles in terms of houses Tutorials-Principles of Economics m health carearrow_forwardIn a small open economy with a floating exchange rate, the supply of real money balances is fixed and a rise in government spending ______ Group of answer choices Raises the interest rate so that net exports must fall to maintain equilibrium in the goods market. Cannot change the interest rate so that net exports must fall to maintain equilibrium in the goods market. Cannot change the interest rate so income must rise to maintain equilibrium in the money market Raises the interest rate, so that income must rise to maintain equilibrium in the money market.arrow_forwardSuppose a country with a fixed exchange rate decides to implement a devaluation of its currency and commits to maintaining the new fixed parity. This implies (A) ______________ in the demand for its goods and a monetary (B) _______________. Group of answer choices (A) expansion ; (B) contraction (A) contraction ; (B) expansion (A) expansion ; (B) expansion (A) contraction ; (B) contractionarrow_forward
- Assume a small open country under fixed exchanges rate and full capital mobility. Prices are fixed in the short run and equilibrium is given initially at point A. An exogenous increase in public spending shifts the IS curve to IS'. Which of the following statements is true? Group of answer choices A new equilibrium is reached at point B. The TR curve will shift down until it passes through point B. A new equilibrium is reached at point C. Point B can only be reached in the absence of capital mobility.arrow_forwardA decrease in money demand causes the real interest rate to _____ and output to _____ in the short run, before prices adjust to restore equilibrium. Group of answer choices rise; rise fall; fall fall; rise rise; fallarrow_forwardIf a country's policy makers were to continously use expansionary monetary policy in an attempt to hold unemployment below the natural rate , the long urn result would be? Group of answer choices a decrease in the unemployment rate an increase in the level of output All of these an increase in the rate of inflationarrow_forward
- A shift in the Aggregate Supply curve to the right will result in a move to a point that is southwest of where the economy is currently at. Group of answer choices True Falsearrow_forwardAn oil shock can cause stagflation, a period of higher inflation and higher unemployment. When this happens, the economy moves to a point to the northeast of where it currently is. After the economy has moved to the northeast, the Federal Reserve can reduce that inflation without having to worry about causing more unemployment. Group of answer choices True Falsearrow_forwardThe long-run Phillips Curve is vertical which indicates Group of answer choices that in the long-run, there is no tradeoff between inflation and unemployment. that in the long-run, there is no tradeoff between inflation and the price level. None of these that in the long-run, the economy returns to a 4 percent level of inflation.arrow_forward
- Suppose the exchange rate between the British pound and the U.S. dollar is £1 = $2.00. The U.S. government implementsU.S. government implements a contractionary fiscal policya contractionary fiscal policy. Illustrate the impact of this change in the market for pounds. 1.) Using the line drawing tool, draw and label a new demand line. 2.) Using the line drawing tool, draw and label a new supply line. Note: Carefully follow the instructions above and only draw the required objects.arrow_forwardJust Part D please, this is for environmental economicsarrow_forward3. Consider a single firm that manufactures chemicals and generates pollution through its emissions E. Researchers have estimated the MDF and MAC curves for the emissions to be the following: MDF = 4E and MAC = 125 – E Policymakers have decided to implement an emissions tax to control pollution. They are aware that a constant per-unit tax of $100 is an efficient policy. Yet they are also aware that this policy is not politically feasible because of the large tax burden it places on the firm. As a result, policymakers propose a two- part tax: a per unit tax of $75 for the first 15 units of emissions an increase in the per unit tax to $100 for all further units of emissions With an emissions tax, what is the general condition that determines how much pollution the regulated party will emit? What is the efficient level of emissions given the above MDF and MAC curves? What are the firm's total tax payments under the constant $100 per-unit tax? What is the firm's total cost of compliance…arrow_forward
 Essentials of Economics (MindTap Course List)EconomicsISBN:9781337091992Author:N. Gregory MankiwPublisher:Cengage Learning
 Brief Principles of Macroeconomics (MindTap Cours...EconomicsISBN:9781337091985Author:N. Gregory MankiwPublisher:Cengage Learning
 Principles of Economics (MindTap Course List)EconomicsISBN:9781305585126Author:N. Gregory MankiwPublisher:Cengage Learning
 Principles of Economics, 7th Edition (MindTap Cou...EconomicsISBN:9781285165875Author:N. Gregory MankiwPublisher:Cengage Learning
 Principles of Microeconomics (MindTap Course List)EconomicsISBN:9781305971493Author:N. Gregory MankiwPublisher:Cengage Learning