
a.
Find the estimated regression equation that could be used to predict the average number of runs given up per inning given the average number of strikeouts per innings pitched.
a.
Answer to Problem 10E
The estimated regression equation that could be used to predict the average number of runs given up per inning given the average number of strikeouts per innings pitched is
Explanation of Solution
Calculation:
The Major League Baseball (MLB) data for the season 2011consists of the average number of earned runs given up by the pitcher per nine innings (ERA), the average number of strikeouts per innings pitched (SO/IP), the average number of home runs per innings pitched (HR/IP) and the number of runs given up per innings pitched (R/IP).
Multiple linear regression model:
A multiple linear regression model is given as
Regression:
Software procedure:
Step by step procedure to get regression equation using MINITAB software is given as,
- Choose Stat > Regression > Regression > Fit Regression Model.
- Under Responses, enter the column of R/IP.
- Under Continuous predictors, enter the columns ofSO/IP.
- Click OK.
The output using MINITAB software is given as,
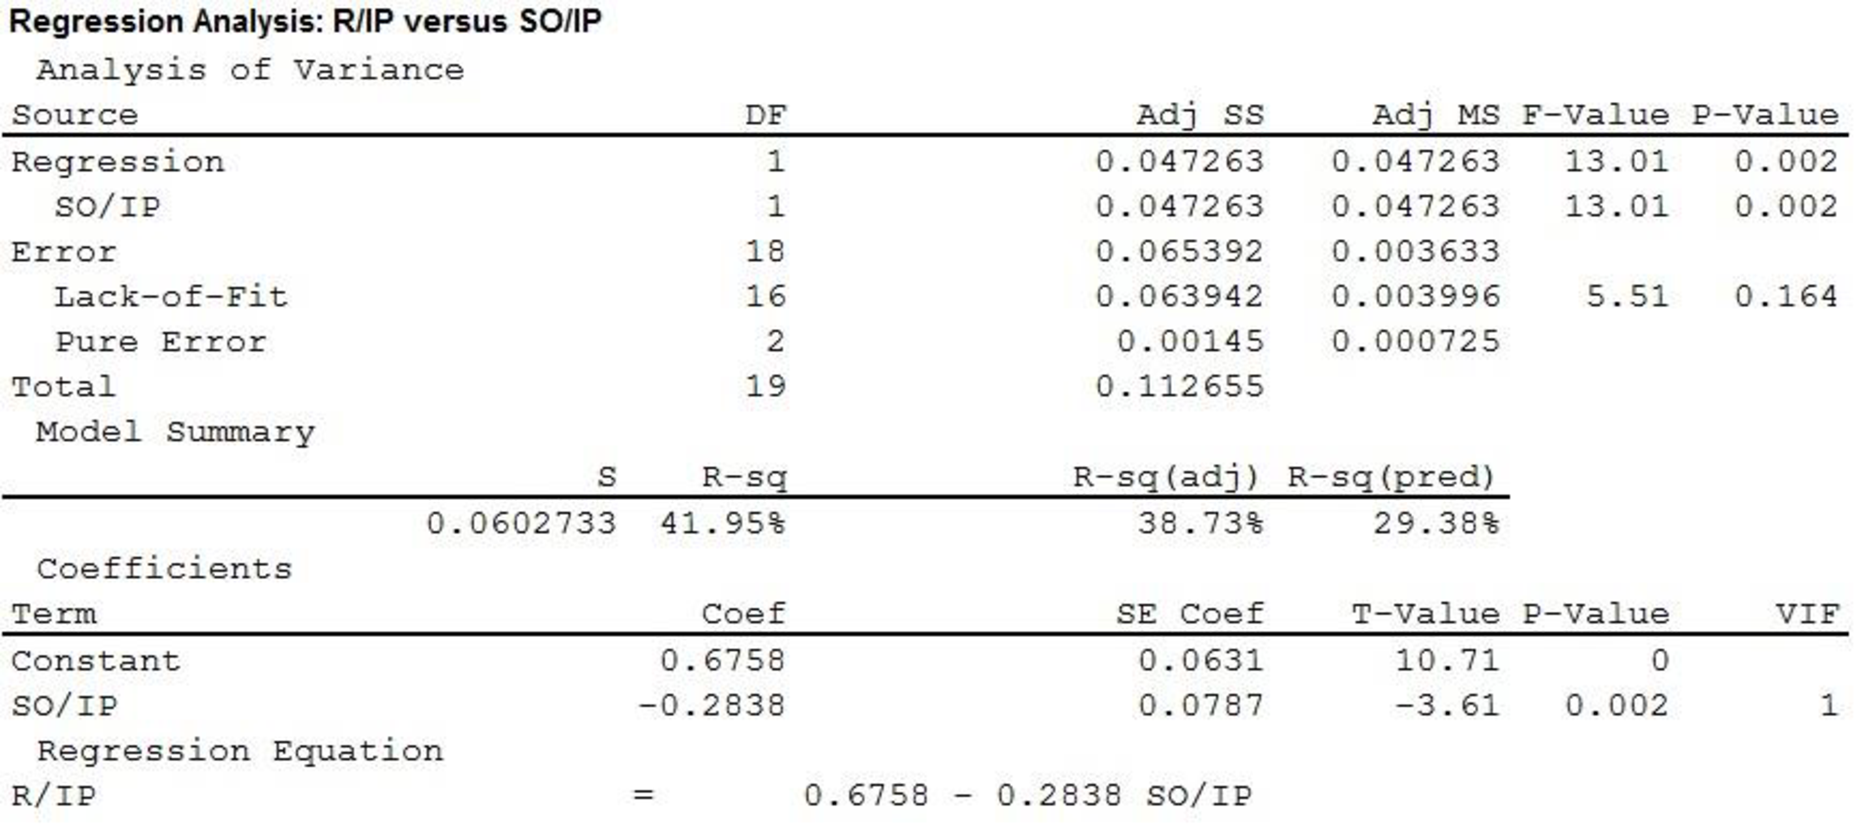
Thus, the estimated regression equation that could be used to predict the average number of runs given up per inning given the average number of strikeouts per innings pitched is
b.
Find the estimated regression equation that could be used to predict the average number of runs given the average number of home runs per innings pitched.
b.
Answer to Problem 10E
The estimated regression equation that could be used to predict the average number of runs given the average number of home runs per innings pitched is
Explanation of Solution
Calculation:
Regression:
Software procedure:
Step by step procedure to get regression equation using MINITAB software is given as,
- Choose Stat > Regression > Regression > Fit Regression Model.
- Under Responses, enter the column of R/IP.
- Under Continuous predictors, enter the column ofHR/IP.
- Click OK.
The output using MINITAB software is given as,
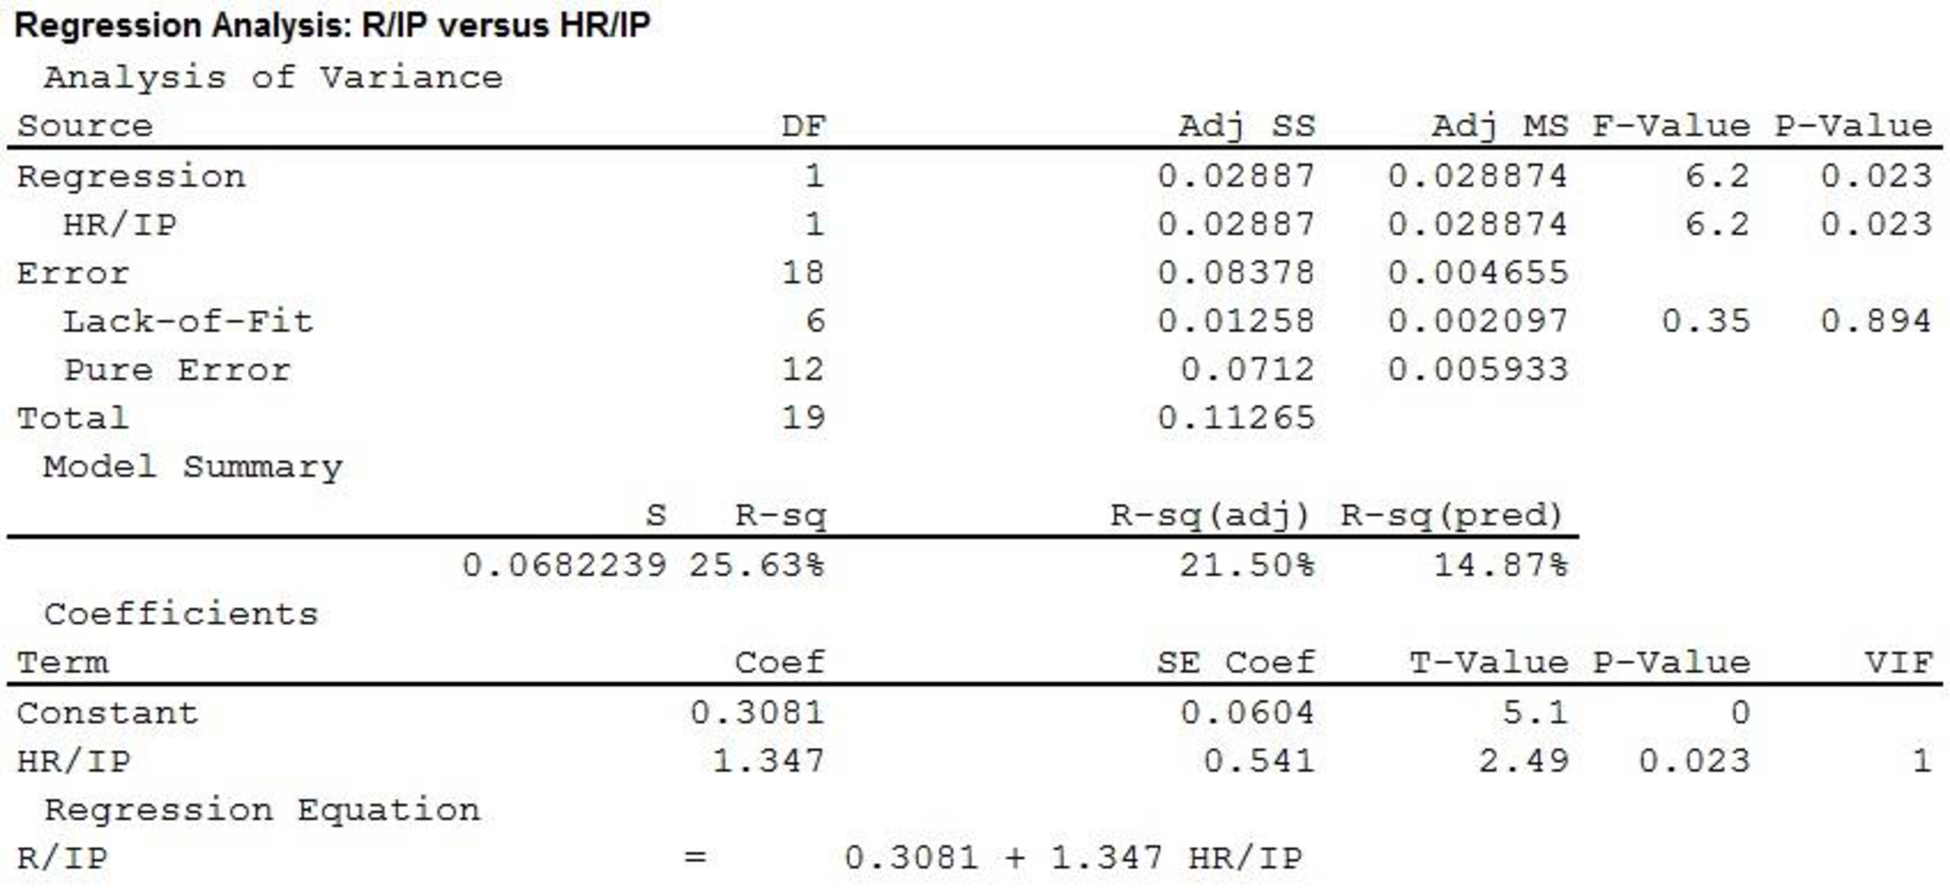
Thus, the estimated regression equation that could be used to predict the average number of runs given the average number of home runs per innings pitched is
c.
Find the estimated regression equation that could be used to predict the average number of runs given the average number of strikeouts per innings pitched and the average number of home runs per innings pitched.
c.
Answer to Problem 10E
The estimated regression equation that could be used to predict the average number of runs given the average number of strikeouts per innings pitched and the average number of home runs per innings pitched is
Explanation of Solution
Calculation:
Regression:
Software procedure:
Step by step procedure to get regression equation using MINITAB software is given as,
- Choose Stat > Regression > Regression > Fit Regression Model.
- Under Responses, enter the column of R/IP.
- Under Continuous predictors, enter the columns ofSO/IP andHR/IP.
- Click OK.
The output using MINITAB software is given as,
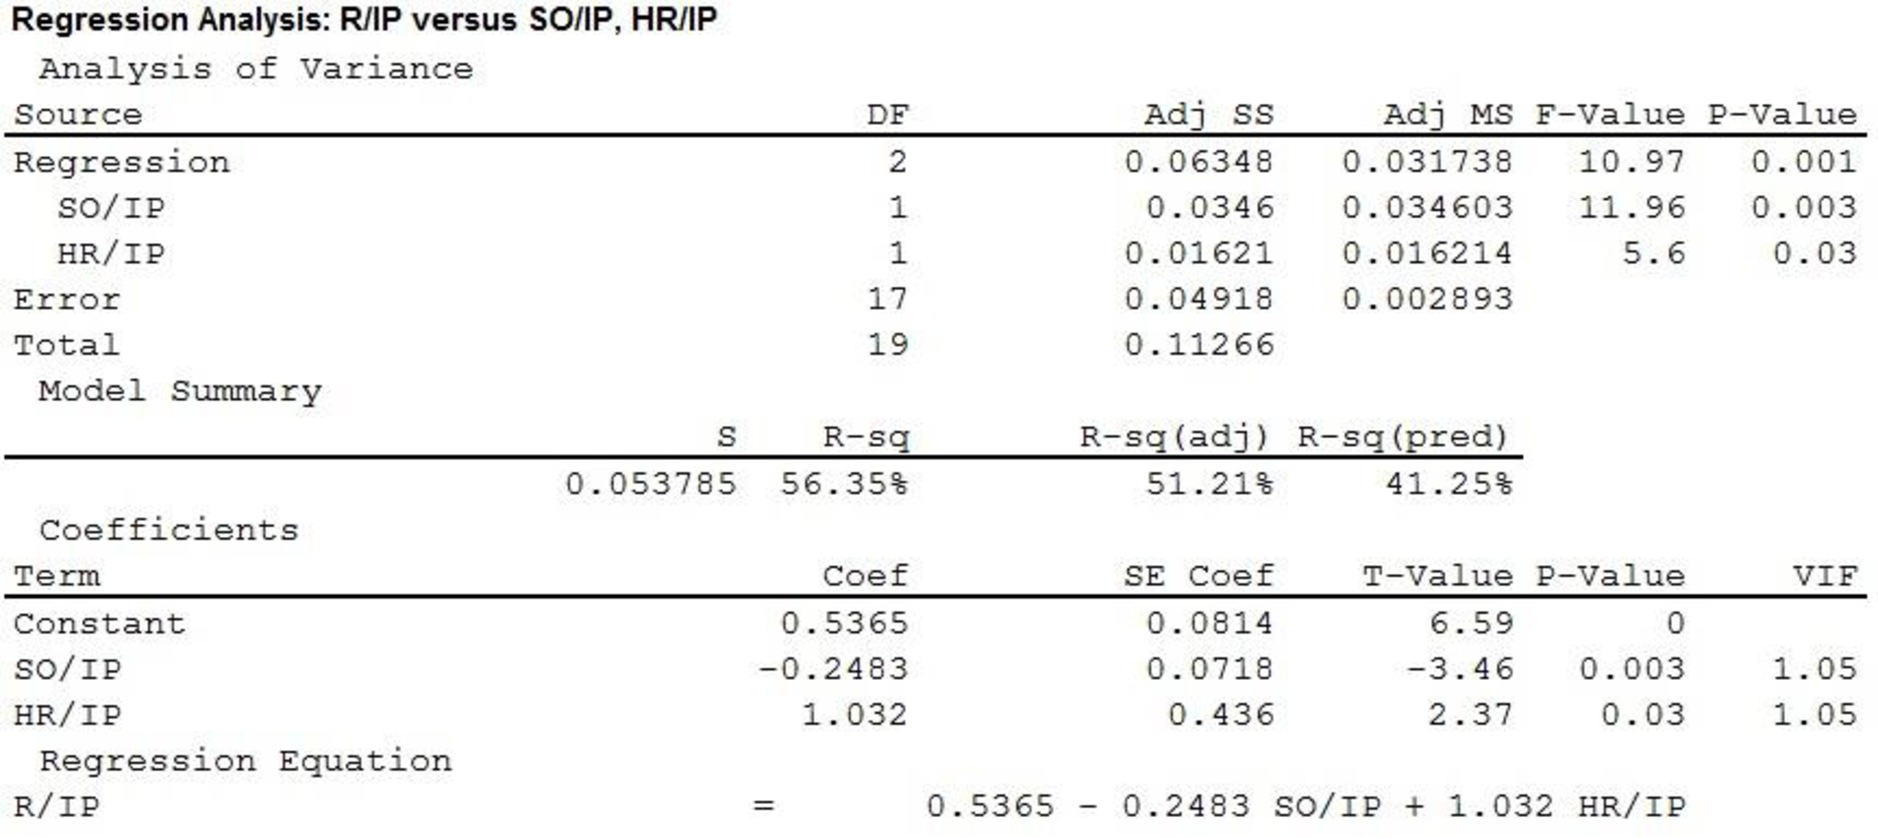
Thus, the estimated regression equation that could be used to predict the average number of runs given the average number of strikeouts per innings pitched and the average number of home runs per innings pitched is
d.
Predict the average number of runs given up per inning for A.J. Burnett using the regression equation of part c.
d.
Answer to Problem 10E
The predicted average number of runs given up per inning for A.J. Burnett is 0.4757.
Explanation of Solution
Calculation:
The average number of strikeouts and the average number of home runs per innings pitched for A.J. Burnet are 0.91 and 0.16, respectively.
From part (c), it is found that estimated regression equation that could be used to predict the average number of runs given the average number of strikeouts per innings pitched and the average number of home runs per innings pitched is
Thus, using the given information the predicted average number of runs given up per inning for A.J. Burnett is,
Thus, the predicted average number of runs given up per inning for A.J. Burnett is 0.4757.
It is to be noted that the actual average number of runs given up per inning for A.J. Burnett was 0.6.
Thus, the predicted value is slightly less than the actual value. Hence, the residual is positive, which underestimate the model slightly.
e.
Explain about the suggestion to use the earned run average as another independent variable.
e.
Explanation of Solution
Calculation:
Software procedure:
Step by step procedure to get correlation coefficient using MINITAB software is given as,
- Choose Stat > Basic Statistics > Correlation.
- Under Variables, enter the column of R/IP and ERA.
- Click OK.
The MINITAB output is given as,
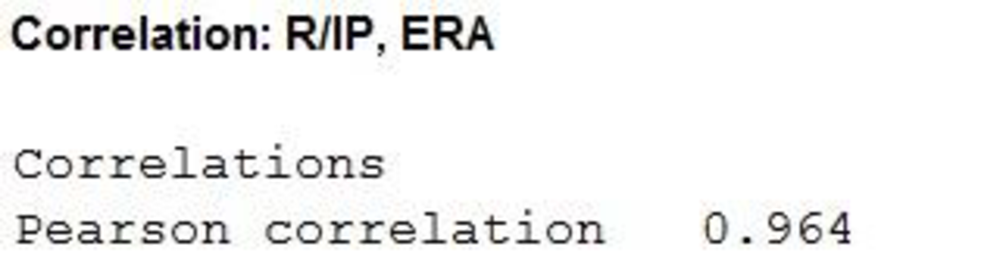
Thus, the correlation coefficient between R/IO and ERA is 0.964.
Due to the high correlation coefficient, it can be said that if a pitcher gives up more runs per innings pitched then pitcher’s run average also increase. Thus, automatically there will be high value of coefficient of determination in the
Thus, the suggestion does not make any sense.
In addition, the ERA can be used as the predictor dependent variable.
Want to see more full solutions like this?
Chapter 15 Solutions
Statistics for Business & Economics, Revised (MindTap Course List)

- Business discussarrow_forwardAnalyze the residuals of a linear regression model and select the best response. yes, the residual plot does not show a curve no, the residual plot shows a curve yes, the residual plot shows a curve no, the residual plot does not show a curve I answered, "No, the residual plot shows a curve." (and this was incorrect). I am not sure why I keep getting these wrong when the answer seems obvious. Please help me understand what the yes and no references in the answer.arrow_forwarda. Find the value of A.b. Find pX(x) and py(y).c. Find pX|y(x|y) and py|X(y|x)d. Are x and y independent? Why or why not?arrow_forward
- Analyze the residuals of a linear regression model and select the best response.Criteria is simple evaluation of possible indications of an exponential model vs. linear model) no, the residual plot does not show a curve yes, the residual plot does not show a curve yes, the residual plot shows a curve no, the residual plot shows a curve I selected: yes, the residual plot shows a curve and it is INCORRECT. Can u help me understand why?arrow_forwardYou have been hired as an intern to run analyses on the data and report the results back to Sarah; the five questions that Sarah needs you to address are given below. please do it step by step on excel Does there appear to be a positive or negative relationship between price and screen size? Use a scatter plot to examine the relationship. Determine and interpret the correlation coefficient between the two variables. In your interpretation, discuss the direction of the relationship (positive, negative, or zero relationship). Also discuss the strength of the relationship. Estimate the relationship between screen size and price using a simple linear regression model and interpret the estimated coefficients. (In your interpretation, tell the dollar amount by which price will change for each unit of increase in screen size). Include the manufacturer dummy variable (Samsung=1, 0 otherwise) and estimate the relationship between screen size, price and manufacturer dummy as a multiple…arrow_forwardHere is data with as the response variable. x y54.4 19.124.9 99.334.5 9.476.6 0.359.4 4.554.4 0.139.2 56.354 15.773.8 9-156.1 319.2Make a scatter plot of this data. Which point is an outlier? Enter as an ordered pair, e.g., (x,y). (x,y)= Find the regression equation for the data set without the outlier. Enter the equation of the form mx+b rounded to three decimal places. y_wo= Find the regression equation for the data set with the outlier. Enter the equation of the form mx+b rounded to three decimal places. y_w=arrow_forward
- You have been hired as an intern to run analyses on the data and report the results back to Sarah; the five questions that Sarah needs you to address are given below. please do it step by step Does there appear to be a positive or negative relationship between price and screen size? Use a scatter plot to examine the relationship. Determine and interpret the correlation coefficient between the two variables. In your interpretation, discuss the direction of the relationship (positive, negative, or zero relationship). Also discuss the strength of the relationship. Estimate the relationship between screen size and price using a simple linear regression model and interpret the estimated coefficients. (In your interpretation, tell the dollar amount by which price will change for each unit of increase in screen size). Include the manufacturer dummy variable (Samsung=1, 0 otherwise) and estimate the relationship between screen size, price and manufacturer dummy as a multiple linear…arrow_forwardExercises: Find all the whole number solutions of the congruence equation. 1. 3x 8 mod 11 2. 2x+3= 8 mod 12 3. 3x+12= 7 mod 10 4. 4x+6= 5 mod 8 5. 5x+3= 8 mod 12arrow_forwardScenario Sales of products by color follow a peculiar, but predictable, pattern that determines how many units will sell in any given year. This pattern is shown below Product Color 1995 1996 1997 Red 28 42 21 1998 23 1999 29 2000 2001 2002 Unit Sales 2003 2004 15 8 4 2 1 2005 2006 discontinued Green 26 39 20 22 28 14 7 4 2 White 43 65 33 36 45 23 12 Brown 58 87 44 48 60 Yellow 37 56 28 31 Black 28 42 21 Orange 19 29 Purple Total 28 42 21 49 68 78 95 123 176 181 164 127 24 179 Questions A) Which color will sell the most units in 2007? B) Which color will sell the most units combined in the 2007 to 2009 period? Please show all your analysis, leave formulas in cells, and specify any assumptions you make.arrow_forward
- One hundred students were surveyed about their preference between dogs and cats. The following two-way table displays data for the sample of students who responded to the survey. Preference Male Female TOTAL Prefers dogs \[36\] \[20\] \[56\] Prefers cats \[10\] \[26\] \[36\] No preference \[2\] \[6\] \[8\] TOTAL \[48\] \[52\] \[100\] problem 1 Find the probability that a randomly selected student prefers dogs.Enter your answer as a fraction or decimal. \[P\left(\text{prefers dogs}\right)=\] Incorrect Check Hide explanation Preference Male Female TOTAL Prefers dogs \[\blueD{36}\] \[\blueD{20}\] \[\blueE{56}\] Prefers cats \[10\] \[26\] \[36\] No preference \[2\] \[6\] \[8\] TOTAL \[48\] \[52\] \[100\] There were \[\blueE{56}\] students in the sample who preferred dogs out of \[100\] total students.arrow_forwardBusiness discussarrow_forwardYou have been hired as an intern to run analyses on the data and report the results back to Sarah; the five questions that Sarah needs you to address are given below. Does there appear to be a positive or negative relationship between price and screen size? Use a scatter plot to examine the relationship. Determine and interpret the correlation coefficient between the two variables. In your interpretation, discuss the direction of the relationship (positive, negative, or zero relationship). Also discuss the strength of the relationship. Estimate the relationship between screen size and price using a simple linear regression model and interpret the estimated coefficients. (In your interpretation, tell the dollar amount by which price will change for each unit of increase in screen size). Include the manufacturer dummy variable (Samsung=1, 0 otherwise) and estimate the relationship between screen size, price and manufacturer dummy as a multiple linear regression model. Interpret the…arrow_forward
 Glencoe Algebra 1, Student Edition, 9780079039897...AlgebraISBN:9780079039897Author:CarterPublisher:McGraw Hill
 Holt Mcdougal Larson Pre-algebra: Student Edition...AlgebraISBN:9780547587776Author:HOLT MCDOUGALPublisher:HOLT MCDOUGAL
 Big Ideas Math A Bridge To Success Algebra 1: Stu...AlgebraISBN:9781680331141Author:HOUGHTON MIFFLIN HARCOURTPublisher:Houghton Mifflin Harcourt
 Algebra: Structure And Method, Book 1AlgebraISBN:9780395977224Author:Richard G. Brown, Mary P. Dolciani, Robert H. Sorgenfrey, William L. ColePublisher:McDougal Littell
 Elementary Geometry For College Students, 7eGeometryISBN:9781337614085Author:Alexander, Daniel C.; Koeberlein, Geralyn M.Publisher:Cengage,
 Algebra & Trigonometry with Analytic GeometryAlgebraISBN:9781133382119Author:SwokowskiPublisher:Cengage