a.
Find the estimated regression equation that could be used to predict the average number of runs given up per inning given the average number of strikeouts per innings pitched.
a.
Answer to Problem 10E
The estimated regression equation that could be used to predict the average number of runs given up per inning given the average number of strikeouts per innings pitched is
Explanation of Solution
Calculation:
The Major League Baseball (MLB) data for the season 2011consists of the average number of earned runs given up by the pitcher per nine innings (ERA), the average number of strikeouts per innings pitched (SO/IP), the average number of home runs per innings pitched (HR/IP) and the number of runs given up per innings pitched (R/IP).
Multiple linear regression model:
A multiple linear regression model is given as
Regression:
Software procedure:
Step by step procedure to get regression equation using MINITAB software is given as,
- Choose Stat > Regression > Regression > Fit Regression Model.
- Under Responses, enter the column of R/IP.
- Under Continuous predictors, enter the columns ofSO/IP.
- Click OK.
The output using MINITAB software is given as,
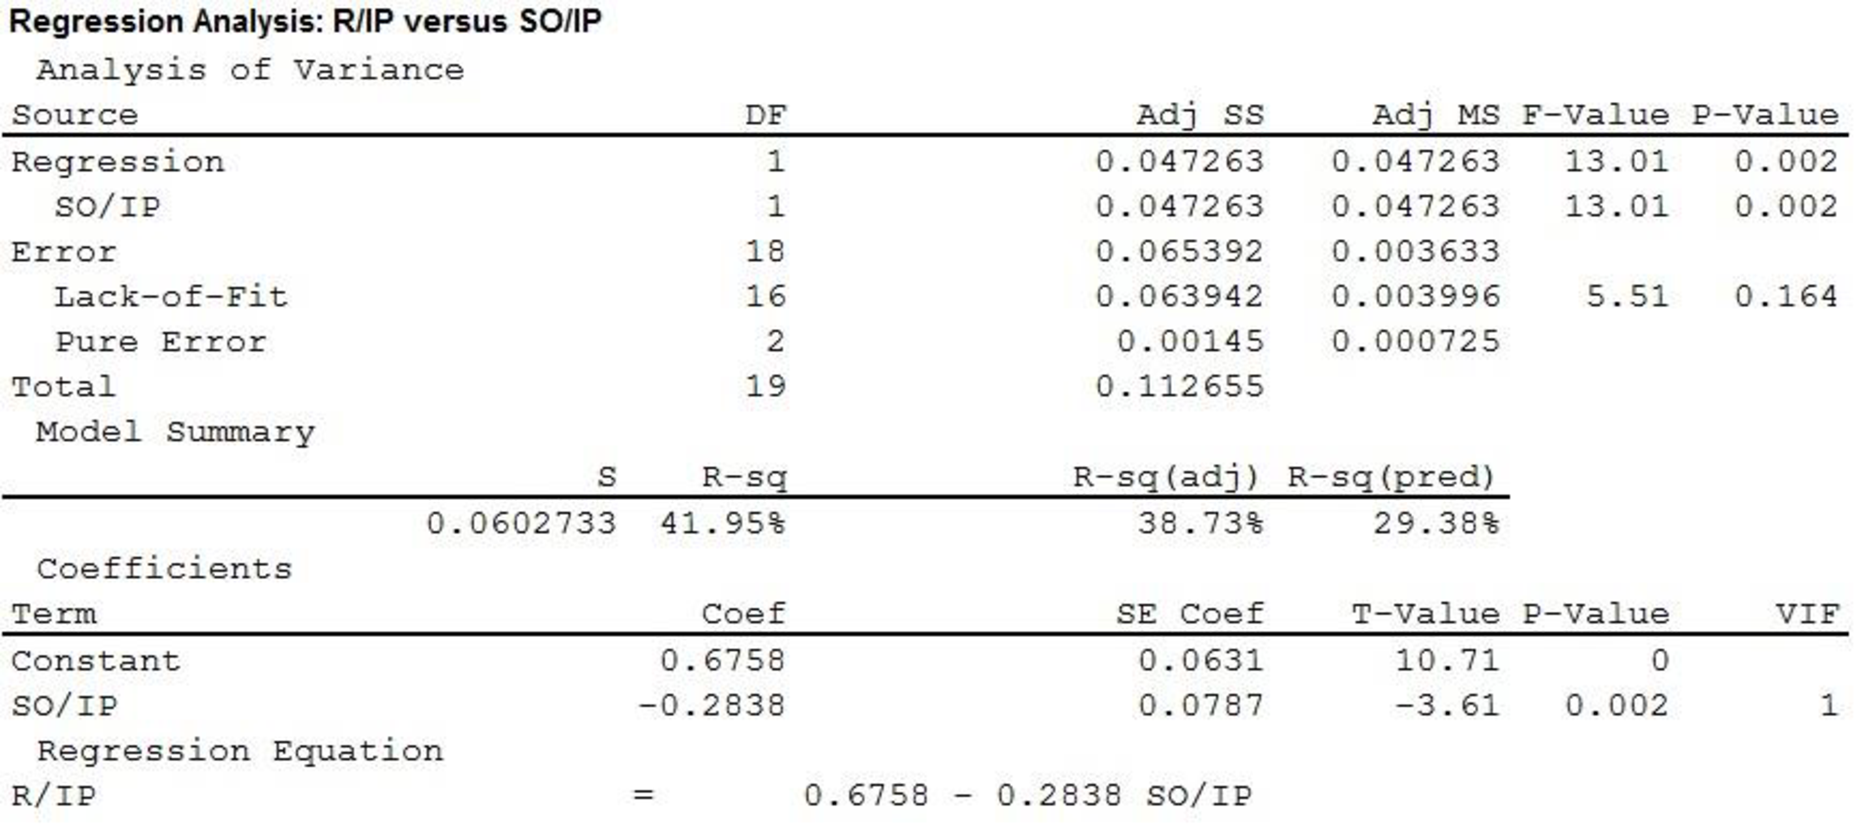
Thus, the estimated regression equation that could be used to predict the average number of runs given up per inning given the average number of strikeouts per innings pitched is
b.
Find the estimated regression equation that could be used to predict the average number of runs given the average number of home runs per innings pitched.
b.
Answer to Problem 10E
The estimated regression equation that could be used to predict the average number of runs given the average number of home runs per innings pitched is
Explanation of Solution
Calculation:
Regression:
Software procedure:
Step by step procedure to get regression equation using MINITAB software is given as,
- Choose Stat > Regression > Regression > Fit Regression Model.
- Under Responses, enter the column of R/IP.
- Under Continuous predictors, enter the column ofHR/IP.
- Click OK.
The output using MINITAB software is given as,
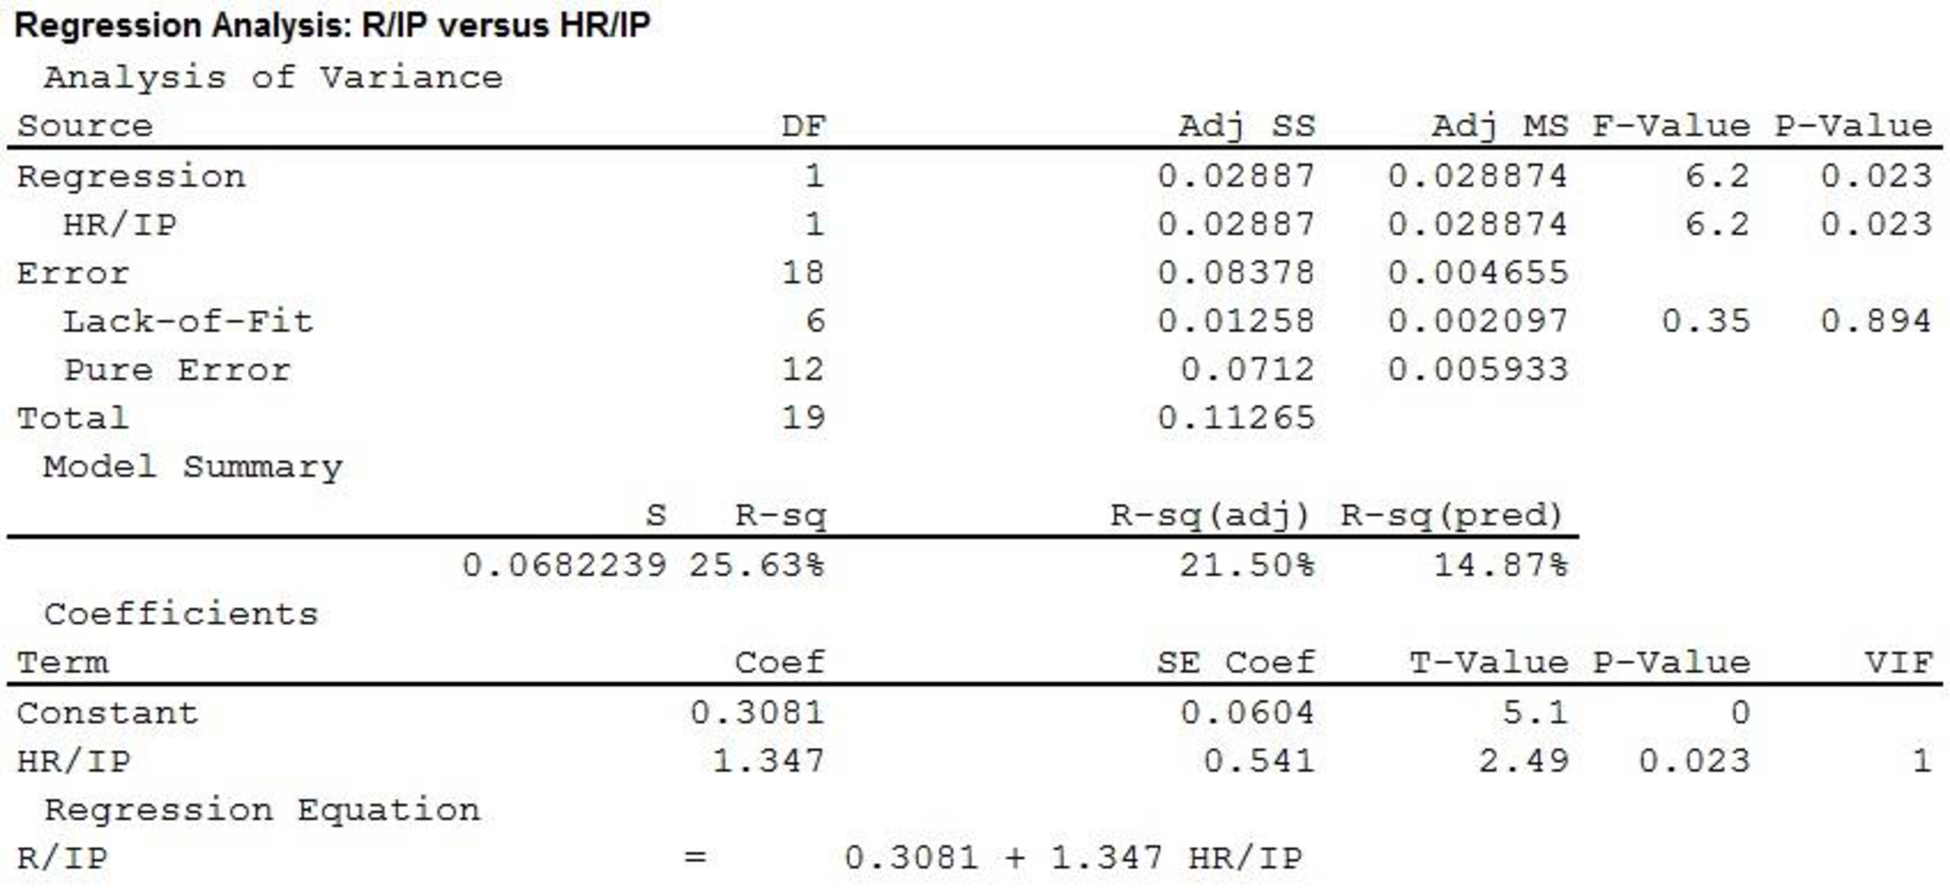
Thus, the estimated regression equation that could be used to predict the average number of runs given the average number of home runs per innings pitched is
c.
Find the estimated regression equation that could be used to predict the average number of runs given the average number of strikeouts per innings pitched and the average number of home runs per innings pitched.
c.
Answer to Problem 10E
The estimated regression equation that could be used to predict the average number of runs given the average number of strikeouts per innings pitched and the average number of home runs per innings pitched is
Explanation of Solution
Calculation:
Regression:
Software procedure:
Step by step procedure to get regression equation using MINITAB software is given as,
- Choose Stat > Regression > Regression > Fit Regression Model.
- Under Responses, enter the column of R/IP.
- Under Continuous predictors, enter the columns ofSO/IP andHR/IP.
- Click OK.
The output using MINITAB software is given as,
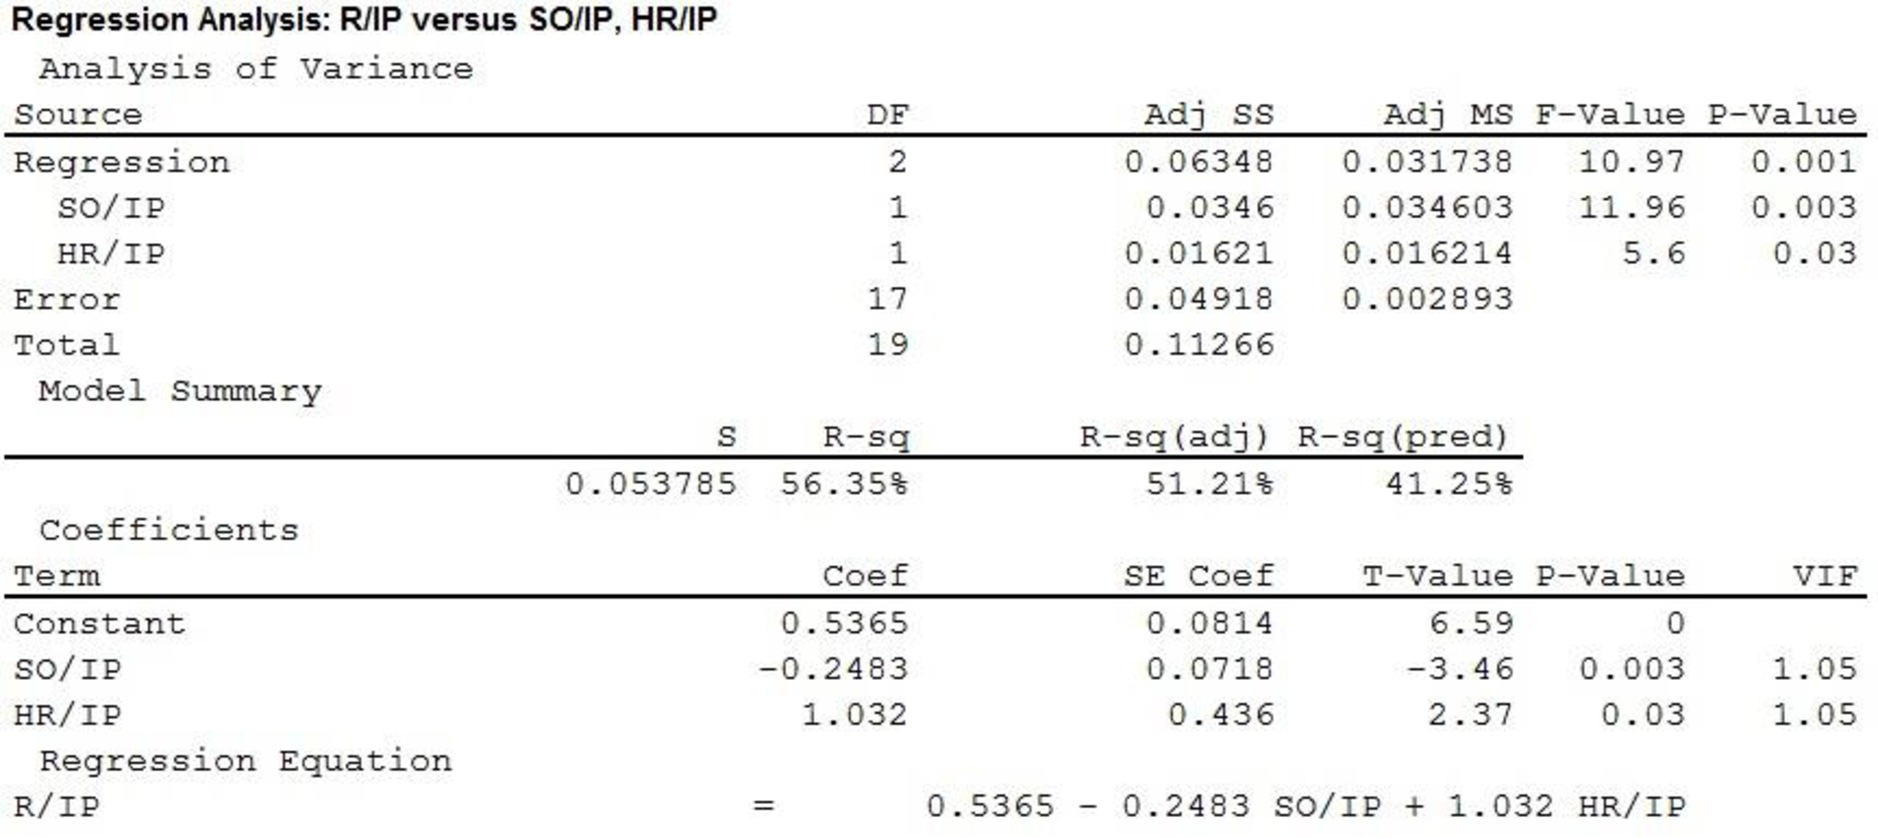
Thus, the estimated regression equation that could be used to predict the average number of runs given the average number of strikeouts per innings pitched and the average number of home runs per innings pitched is
d.
Predict the average number of runs given up per inning for A.J. Burnett using the regression equation of part c.
d.
Answer to Problem 10E
The predicted average number of runs given up per inning for A.J. Burnett is 0.4757.
Explanation of Solution
Calculation:
The average number of strikeouts and the average number of home runs per innings pitched for A.J. Burnet are 0.91 and 0.16, respectively.
From part (c), it is found that estimated regression equation that could be used to predict the average number of runs given the average number of strikeouts per innings pitched and the average number of home runs per innings pitched is
Thus, using the given information the predicted average number of runs given up per inning for A.J. Burnett is,
Thus, the predicted average number of runs given up per inning for A.J. Burnett is 0.4757.
It is to be noted that the actual average number of runs given up per inning for A.J. Burnett was 0.6.
Thus, the predicted value is slightly less than the actual value. Hence, the residual is positive, which underestimate the model slightly.
e.
Explain about the suggestion to use the earned run average as another independent variable.
e.
Explanation of Solution
Calculation:
Software procedure:
Step by step procedure to get correlation coefficient using MINITAB software is given as,
- Choose Stat > Basic Statistics > Correlation.
- Under Variables, enter the column of R/IP and ERA.
- Click OK.
The MINITAB output is given as,
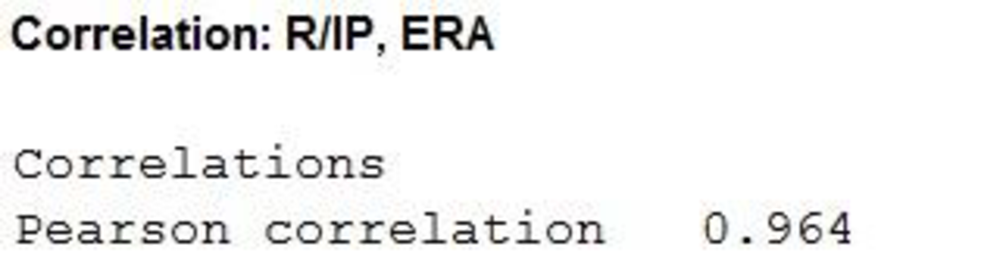
Thus, the correlation coefficient between R/IO and ERA is 0.964.
Due to the high correlation coefficient, it can be said that if a pitcher gives up more runs per innings pitched then pitcher’s run average also increase. Thus, automatically there will be high value of coefficient of determination in the
Thus, the suggestion does not make any sense.
In addition, the ERA can be used as the predictor dependent variable.
Want to see more full solutions like this?
Chapter 15 Solutions
Statistics for Business & Economics

- A marketing agency wants to determine whether different advertising platforms generate significantly different levels of customer engagement. The agency measures the average number of daily clicks on ads for three platforms: Social Media, Search Engines, and Email Campaigns. The agency collects data on daily clicks for each platform over a 10-day period and wants to test whether there is a statistically significant difference in the mean number of daily clicks among these platforms. Conduct ANOVA test. You can provide your answer by inserting a text box and the answer must include: also please provide a step by on getting the answers in excel Null hypothesis, Alternative hypothesis, Show answer (output table/summary table), and Conclusion based on the P value.arrow_forwardA company found that the daily sales revenue of its flagship product follows a normal distribution with a mean of $4500 and a standard deviation of $450. The company defines a "high-sales day" that is, any day with sales exceeding $4800. please provide a step by step on how to get the answers Q: What percentage of days can the company expect to have "high-sales days" or sales greater than $4800? Q: What is the sales revenue threshold for the bottom 10% of days? (please note that 10% refers to the probability/area under bell curve towards the lower tail of bell curve) Provide answers in the yellow cellsarrow_forwardBusiness Discussarrow_forward
- The following data represent total ventilation measured in liters of air per minute per square meter of body area for two independent (and randomly chosen) samples. Analyze these data using the appropriate non-parametric hypothesis testarrow_forwardeach column represents before & after measurements on the same individual. Analyze with the appropriate non-parametric hypothesis test for a paired design.arrow_forwardShould you be confident in applying your regression equation to estimate the heart rate of a python at 35°C? Why or why not?arrow_forward
 Glencoe Algebra 1, Student Edition, 9780079039897...AlgebraISBN:9780079039897Author:CarterPublisher:McGraw Hill
 Holt Mcdougal Larson Pre-algebra: Student Edition...AlgebraISBN:9780547587776Author:HOLT MCDOUGALPublisher:HOLT MCDOUGAL
 Big Ideas Math A Bridge To Success Algebra 1: Stu...AlgebraISBN:9781680331141Author:HOUGHTON MIFFLIN HARCOURTPublisher:Houghton Mifflin Harcourt
 Algebra: Structure And Method, Book 1AlgebraISBN:9780395977224Author:Richard G. Brown, Mary P. Dolciani, Robert H. Sorgenfrey, William L. ColePublisher:McDougal Littell
 Elementary Geometry For College Students, 7eGeometryISBN:9781337614085Author:Alexander, Daniel C.; Koeberlein, Geralyn M.Publisher:Cengage,
 Algebra & Trigonometry with Analytic GeometryAlgebraISBN:9781133382119Author:SwokowskiPublisher:Cengage