
Concept explainers
Videos
Weight loss: A weight loss company claims that the
- State the appropriate null and alternate hypotheses.
- Compute the value of the test statistic.
- Find the critical value.
- State a conclusion.
a.
To find:The value of test statistic.
Answer to Problem 11E
The hypothesis are
Explanation of Solution
Given information:
The given data is,
Concept used:
The test statistic is,
If the sample size is less than or equal to
If the sample size is greater than
Here, the number of times the less frequent sign occur is
The conditions for test statistics are shown below in table.
| Type of test | Test statistic |
| Right-tailed test | Number of minus signs |
| Left-tailed test | Number of plus signs |
| Two-tailed test | Number of plus or minus signs, whichever is smaller |
Calculations:
The hypothesis are,
Therefore, the hypothesis are
b.
To find:The value of test statistic.
Answer to Problem 11E
The value of test statistic is
Explanation of Solution
Given information:
The given data is,
Concept used:
The test statistic is,
If the sample size is less than or equal to
If the sample size is greater than
Here, the number of times the less frequent sign occur is
The conditions for test statistics are shown below in table.
| Type of test | Test statistic |
| Right-tailed test | Number of minus signs |
| Left-tailed test | Number of plus signs |
| Two-tailed test | Number of plus or minus signs, whichever is smaller |
Calculations:
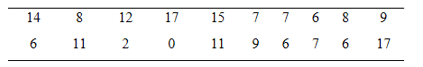
The value of test statistic is shown below.
| Sample | Difference | Signs |
| 14 | 14-15 =-I | - |
| 8 | 8-15 =-7 | - |
| 12 | 12 -15 =-3 | - |
| 17 | 17 -15=+2 | + |
| 15 | 15-15 =0 | 0 |
| 7 | 7-15= -8 | - |
| 7 | 7-15= -8 | - |
| 6 | 6-15 =-9 | - |
| 8 | 8-15 =-7 | - |
| 9 | 9-15 =--6 | - |
| 6 | 6-15=-9 | - |
| 11 | 11-15 =-4 | - |
| 2 | 2- 15=-13 | - |
| 0 | 0-15=-15 | - |
| 11 | 11-15 =-4 | - |
| 9 | 9-15 =--6 | - |
| 6 | 6-15 =-9 | - |
| 7 | 7-15= -8 | - |
| 6 | 6-15 =-9 | - |
| 17 | 17 - 15=+2 | + |
From the above table, the number of minus sign is
Since, the sample size is less than
The test statistic is given by the number of plus or minus sign which are smaller in number.
Therefore, the value of test statistic for the given sample is
c.
To find:The critical value.
Answer to Problem 11E
The critical value is
Explanation of Solution
Given information:
The level of significance is
Calculations:
The critical value for one-tailed test at of significance of
Therefore, the critical value is
d.
To find:The conclusion for the test.
Answer to Problem 11E
The median weight loss for people who follow their program is less than
Explanation of Solution
Given information:
The level of significance is
Calculations:
The critical value for one-tailed test at of significance of
Since, the test statistics is
Thus, the hypothesis
Therefore, the median weight loss for people who follow their program is less than
Want to see more full solutions like this?
Chapter 15 Solutions
Elementary Statistics (Text Only)


- A company found that the daily sales revenue of its flagship product follows a normal distribution with a mean of $4500 and a standard deviation of $450. The company defines a "high-sales day" that is, any day with sales exceeding $4800. please provide a step by step on how to get the answers in excel Q: What percentage of days can the company expect to have "high-sales days" or sales greater than $4800? Q: What is the sales revenue threshold for the bottom 10% of days? (please note that 10% refers to the probability/area under bell curve towards the lower tail of bell curve) Provide answers in the yellow cellsarrow_forwardFind the critical value for a left-tailed test using the F distribution with a 0.025, degrees of freedom in the numerator=12, and degrees of freedom in the denominator = 50. A portion of the table of critical values of the F-distribution is provided. Click the icon to view the partial table of critical values of the F-distribution. What is the critical value? (Round to two decimal places as needed.)arrow_forwardA retail store manager claims that the average daily sales of the store are $1,500. You aim to test whether the actual average daily sales differ significantly from this claimed value. You can provide your answer by inserting a text box and the answer must include: Null hypothesis, Alternative hypothesis, Show answer (output table/summary table), and Conclusion based on the P value. Showing the calculation is a must. If calculation is missing,so please provide a step by step on the answers Numerical answers in the yellow cellsarrow_forward
 Glencoe Algebra 1, Student Edition, 9780079039897...AlgebraISBN:9780079039897Author:CarterPublisher:McGraw Hill
 College Algebra (MindTap Course List)AlgebraISBN:9781305652231Author:R. David Gustafson, Jeff HughesPublisher:Cengage Learning