Concept explainers
Videos
Meteorology The table shows the maximum daily high temperatures (in degrees Fahrenheit) in
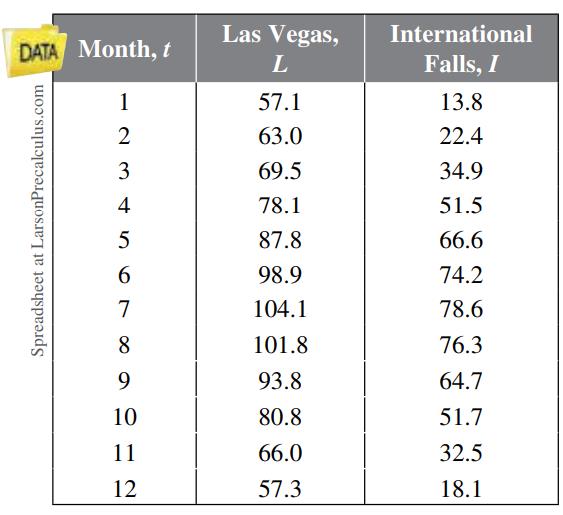
(a) A model for the temperatures in
Find a trigonometric model for the temperatures in International Falls.
(b) Use a graphing utility to graph the data points and the model for the temperatures in
(c) Use the graphing utility to graph the data points and the model for the temperatures in International Falls. How well does the model fit the data?
(d) Use the models to estimate the average maximum temperature in each city. Which value in each model did you use? Explain.
(e) What is the period of each model? Are the periods what you expected? Explain.
(f) Which city has the greater variability in temperature throughout the year? Which value in each model determines this variability? Explain.

Trending nowThis is a popular solution!

Chapter 1 Solutions
Bundle: Trigonometry, Loose-leaf Version, 10th + Webassign Printed Access Card For Larson's Trigonometry, 10th Edition, Single-term


 Algebra & Trigonometry with Analytic GeometryAlgebraISBN:9781133382119Author:SwokowskiPublisher:Cengage
 Trigonometry (MindTap Course List)TrigonometryISBN:9781305652224Author:Charles P. McKeague, Mark D. TurnerPublisher:Cengage Learning