
PRINCIPLES OF MICROECONOMICS (OER)
2nd Edition
ISBN: 9781947172340
Author: Timothy Taylor, Steven A. Greenlaw
Publisher: OpenStax
expand_more
expand_more
format_list_bulleted
Textbook Question
Chapter 15, Problem 7SCQ
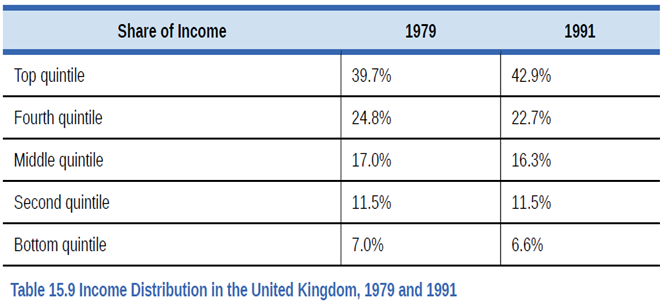
Table 15.9 shows the share of income going to each quintile of the income distribution for the United Kingdom in 1979 and 1991. Use this data to calculate what the points on a Lorenz curve would be, and sketch the Lorenz curve. How did inequality in the United Kingdom shift over this time period? How can you see the patterns in the quintiles in the Lorenz curves?
Expert Solution & Answer
Want to see the full answer?
Check out a sample textbook solution
Students have asked these similar questions
Economics Grade
3
CONDUCT RESEARCH ON (the various) MARKET STRUCTURES
Research Project/May
Explain the concept market structure and explain why there are perfect and
imperfect market structures.
(5)
• Provide reasons as to why the taxi industry is regarded as operating in a
monopolistic competitive structure.
(10)
• How do monopolies impact consumers and the economy.
(10)
• Use graph(s) to explain the long run equilibrium price and output in a
perfect market.
(10)
• Evaluate the effectiveness of South Africa's competition policy in curbing
anticompetitive tendencies in the market. Make use of practical examples.
(10)
GRAND TOTAL:50
Please turn
Copyright
UGD KCQ 2: Microeconomic Essentials (page 11 of 20) - Google Chrome
mancosaconnect.ac.za/mod/quiz/attempt.php?attempt=1958913&cmid=436375&page=10
MANCOSA
Microeconomic Essentials Jan25 Y1 S1
Back
Refer to the diagram below to answer the question that follows:
Price
PH
P1
D₁
ㅁ
X
Quiz navigation
3 4 5 6
Time left 0:58:34
1
2
Question 11
7 8
Not yet answered
Marked out of 1.00
13
33
14
S₁
Flag question
Q Q1
Quantity
Which of the following may result in a shift of the supply curve from S to S1?
OA. An increase in price of the good.
B. An increase in wages.
O C. A decrease in price of the good.
O D. An improvement in the technique of production.
https://mancosaconnect.ac.za/mod/quiz/attempt.php?attempt=1958913&cmid=436375&page=10#question-2064270-11
19 20
6
10
10
11 12
15 Question 11- Not yet answered
Finish attempt...
7:31 PM
Euros per U.S. Doler
Consider the model below, showing the supply and demand curves for the exchange market of U.S. Dollars and Euros. If
the inflation rate in the U.S. increases (and in the European Union stays the same), how will that change the original
equilibrium shown in the graph?
1.10-
1.00-
0.90
0.80-
0.70
0.60
0.50-
0.40-
0.30
0.20
E
4.7 48 49 50 51 52 53 54 55 56
Quantity of U.S. Dollars traded for Euros
(trillionsday)
O It will decrease the demand for Dollars and increase the supply, so the exchange rate decreases and the impact on the quantity traded
is unknown.
O It will decrease the demand for Dollars and increase the supply, so the exchange rate decreases, and the quantity traded increases.
It will increase the demand for Dollars and decrease the supply, so the exchange rate decreases, and the quantity traded increases.
It will increase the demand for Dollars and decrease the supply, so the exchange rate increases and the impact on the quantity traded
is unknown
Chapter 15 Solutions
PRINCIPLES OF MICROECONOMICS (OER)
Ch. 15 - Describe how each of these changes is likely to...Ch. 15 - Jonathan is a single father with one child. He can...Ch. 15 - Imagine that the government reworks the welfare...Ch. 15 - We have discovered that the welfare system...Ch. 15 - How does the TANF attempt to loosen the poverty...Ch. 15 - A group 0f 10 people have the following annual...Ch. 15 - Table 15.9 shows the share of income going to each...Ch. 15 - Using two demand and supply diagrams, one for the...Ch. 15 - Using two demand and supply diagrams, one for the...Ch. 15 - Here is one hypothesis: A well-funded social...
Ch. 15 - Here is a second hypothesis: A well-funded social...Ch. 15 - Which set of policies is more likely to cause a...Ch. 15 - Why is there reluctance on the part of some in the...Ch. 15 - How is the poverty rate calculated?Ch. 15 - What is the poverty line?Ch. 15 - What is the difference between poverty and income...Ch. 15 - How does the poverty trap discourage people from...Ch. 15 - How can the effect of the poverty trap be reduced?Ch. 15 - Who are the near-poor?Ch. 15 - What is the safety net?Ch. 15 - Briefly explain the differences between TANF, the...Ch. 15 - Who is included in the top income quintile?Ch. 15 - What is measured on the two axes of a Lorenz...Ch. 15 - If a country had perfect income equality what...Ch. 15 - How has the inequality of income changed in the...Ch. 15 - What are some reasons why a certain degree of...Ch. 15 - What are the main reasons economists give for the...Ch. 15 - Identify some public policies that can reduce the...Ch. 15 - Describe how a push for economic equality might...Ch. 15 - What goods and services would you include in an...Ch. 15 - If a family of three earned 20,000, would they be...Ch. 15 - Exercise 15.2 and Exercise 15.3 asked you to...Ch. 15 - Explain how you would create a government program...Ch. 15 - Many critics of government programs to help...Ch. 15 - Think about the business cycle: during a...Ch. 15 - Explain how a country may experience greater...Ch. 15 - The demand for skilled workers in the United...Ch. 15 - Explain a situation using the supply and demand...Ch. 15 - What do you think is more important to focus on...Ch. 15 - To reduce income inequality, should the marginal...Ch. 15 - Redistribution of income occurs through the...Ch. 15 - How does a society or a country make the decision...Ch. 15 - Explain what the long- and short-term consequences...Ch. 15 - In country A, the population is 300 million and 50...Ch. 15 - In country B, the population is 900 million and...Ch. 15 - Susan is a single mother with three children. She...Ch. 15 - A group of 10 people have the following annual...
Additional Business Textbook Solutions
Find more solutions based on key concepts
Preference for current ratio and quick ratio. Introduction: Current ratio explains the liquidity position of a ...
Gitman: Principl Manageri Finance_15 (15th Edition) (What's New in Finance)
Depreciation Methods, Disposal. Kurtis Koal Company, Inc. purchased a new mining machine at a total cost of 900...
Intermediate Accounting (2nd Edition)
Why is the capital-budgeting process so important?
Foundations Of Finance
What is an action plan? Why are action plans such an important part of market planning? Why is it so important ...
MARKETING:REAL PEOPLE,REAL CHOICES
An experimental composite engine block for an automobile will trim 20 pounds of weight compared with a traditio...
Engineering Economy (17th Edition)
What is the relationship between management by exception and variance analysis?
Horngren's Cost Accounting: A Managerial Emphasis (16th Edition)
Knowledge Booster

Similar questions
- If the US Federal Reserve increases interests on reserves, how will that change the original equilibrium shown in the graph? Euros par US alar 1.10 1.00 0.90- E 0.80- 0.70 0.60 0.50 0.40- 0.30 0.20 47 48 49 50 51 52 53 54 55 56 Quantity of US Dollars traded for Euros (trillions/day) It will increase the demand for Dollars and decrease the supply, so the exchange rate decreases, and the quantity traded increases. O It will decrease the demand for Dollars and increase the supply, so the exchange rate decreases and the impact on the quantity traded is unknown. O It will increase the demand for Dollars and decrease the supply, so the exchange rate increases and the impact on the quantity traded is unknown O It will decrease the demand for Dollars and increase the supply, so the exchange rate decreases, and the quantity traded increases. Question 22 5 ptsarrow_forward1. Based on the video, answer the following questions. • What are the 5 key characteristics that differentiate perfect competition from monopoly? Based on the video. • How does the number of sellers in a market influence the type of market structure? Based on the video. • In what ways does product differentiation play a role in monopolistic competition? Based on the video. • How do barriers to entry affect the level of competition in an oligopoly? Based on the video. • Why might firms in an oligopolistic market engage in non-price competition rather than price wars? Based on the video. Reference video: https://youtu.be/Qrr-IGR1kvE?si=h4q2F1JFNoCI36TVarrow_forward1. Answer the following questions based on the reference video below: • What are the 5 key characteristics that differentiate perfect competition from monopoly? • How does the number of sellers in a market influence the type of market structure? • In what ways does product differentiation play a role in monopolistic competition? • How do barriers to entry affect the level of competition in an oligopoly? • Why might firms in an oligopolistic market engage in non-price competition rather than price wars? Discuss. Reference video: https://youtu.be/Qrr-IGR1kvE?si=h4q2F1JFNoCI36TVarrow_forward
- Explain the importance of differential calculus within economics and business analysis. Provide three refernces with your answer. They can be from websites or a journals.arrow_forwardAnalyze the graph below, showing the Gross Federal Debt as a percentage of GDP for the United States (1939-2019). Which of the following is correct? FRED Gross Federal Debt as Percent of Gross Domestic Product Percent of GDP 120 110 100 60 50 40 90 30 1940 1950 1960 1970 Shaded areas indicate US recessions 1980 1990 2000 2010 1000 Sources: OMD, St. Louis Fed myfred/g/U In 2019, the Federal Government of the United States had an accumulated debt/GDP higher than 100%, meaning that the amount of debt accumulated over time is higher than the value of all goods and services produced in that year. The debt/GDP is always positive during this period, so the Federal Government of the United States incurred in budget deficits every year since 1939. From the mid-40s until the mid-70s, the debt/DGP was decreasing, meaning that the Federal Government of the United States was running a budget surplus every year during those three decades. During the second half of the 1970s, the Federal Government…arrow_forwardAn imaginary country estimates that their economy can be approximated by the AD/AS model below. How can this government act to move the equilibrium to potential GDP? LRAS Price Level P Y Real GDP E SRAS AD The AD/AS model shows that a contractionary fiscal policy is suitable, but the choice of increasing taxes, decreasing government expenditure or doing both simultaneously is mostly political The AD/AS model shows that increasing taxes is the best fiscal policy available. The AD/AS model shows that decreasing government expenditure is the best fiscal policy available. The AD/AS model shows that an expansionary fiscal policy capable of shifting the AD curve to the potential GDP level would decrease Real GDP but increase inflationary pressuresarrow_forward
- Question 1 Coursology Consider the four policies bellow. Classify them as either fiscal or monetary policy: I. The United States Government promoting tax cuts for small businesses to prevent a wave of bankruptcies during the COVID-19 pandemic II. The Congress approving a higher budget for the Affordable Health Care Act (also known as Obamacare) III. The Federal Reserve increasing the required reserves for commercial banks aiming to control the rise of inflation IV. President Joe Biden approving a new round of stimulus checks for households I. fiscal, II. fiscal, III. monetary, IV. fiscal I. fiscal, II. monetary, III. monetary, IV. monetary I. monetary, II. fiscal, III. fiscal, IV. fiscal I. monetary, II. monetary, III. fiscal, IV. monetaryarrow_forwardConsider the following supply and demand schedule of wooden tables.a. Draw the corresponding graphs for supply and demand.b. Using the data, obtain the corresponding supply and demand functions. c. Find the market-clearing price and quantity. Price (Thousand s USD Supply Demand 2 96 1104 196 1906 296 2708 396 35010 496 43012 596 51014 696 59016 796 67018 896 75020…arrow_forwardConsider a firm with the following production function Q=5000L-2L2.a. Find the maximum production level.b. How many units of labour are needed at that point. c. Obtain the function of marginal product of labour (MRL) d. Graph the production function and the MRL.arrow_forward
- Exercise 4A firm has the following total cost function TC=100q-5q2+0.5q3. Find the average cost function.arrow_forwardA firm has the following demand function P=200 − 2Q and the average costof AC= 100/Q + 3Q −20.a. Find the profit function. b. Estimate the marginal cost function. c. Obtain the production that maximizes the profit. d. Evaluate the average cost and the marginal cost at the maximising production level.arrow_forwardRubber: Initial investment: $159,000 Annual cost: $36,000 Annual revenue: $101,000 Salvage value: $12,000 Useful life: 10 years Using the cotermination assumptions, a study period of 6 years, and a MARR of 9%, what is the present worth of the rubber alternative? Assume that the rubber alternative's equipment has a market value of $18,000 at the end of Year 6.arrow_forward
arrow_back_ios
SEE MORE QUESTIONS
arrow_forward_ios
Recommended textbooks for you


 Principles of Economics 2eEconomicsISBN:9781947172364Author:Steven A. Greenlaw; David ShapiroPublisher:OpenStax
 Economics (MindTap Course List)EconomicsISBN:9781337617383Author:Roger A. ArnoldPublisher:Cengage Learning
Principles of Economics 2e
Economics
ISBN:9781947172364
Author:Steven A. Greenlaw; David Shapiro
Publisher:OpenStax
Economics (MindTap Course List)
Economics
ISBN:9781337617383
Author:Roger A. Arnold
Publisher:Cengage Learning