Sub part (a):
Impact of different views on inflation on the economy's equilibrium.
Sub part (a):
Explanation of Solution
The supply is dependent upon the
The
When the new chairman is one with the view that the inflation is not a big issue on the economy, the economy would identify the chairman as the silent supporter of the inflation, and they will expect that the chairman will not introduce the active policies to fight against and control the inflation in the economy. As a result, the public will expect that the rise in the inflation and the price level are likely to rise.
Concept introduction:
Aggregate demand curve: It is the curve that shows the relationship between the price level in the economy and the quantity of real GDP demanded by the economic agents such as the households, firms, and the government.
Equilibrium: The equilibrium in the economy is the point where the economy's aggregate demand curve and the aggregate supply curve intersect with each other. There will be no excess demand or
Sub part (b):
Impact of different views on inflation on the economy's equilibrium.
Sub part (b):
Explanation of Solution
When the people expect higher inflation for the next year, they will start to calculate the changes in the price level. According to the expected higher level of inflation over the next year, they will expect higher cost of living for the next year. As a result of this, they will demand higher nominal wage rate for the next year with the employers.
Concept introduction:
Aggregate demand curve: It is the curve that shows the relationship between the price level in the economy and the quantity of real GDP demanded by the economic agents such as the households, firms, and the government.
Aggregate supply curve: In the short run, it is a curve that shows the relationship between the price level in the economy and the supply in the economy by the firms. In the long run, it shows the relationship between the price level and the level of quantity supplied by the firms.
Equilibrium: The equilibrium in the economy is the point where the economy's aggregate demand curve and the aggregate supply curve intersect with each other. There will be no excess demand or excess supply in the economy at the equilibrium.
Sub part (c):
Impact of different views on inflation on the economy's equilibrium.
Sub part (c):
Explanation of Solution
The profit of the firm is the difference between the total cost and the total revenue of the firm's products. When the total cost is higher than the total revenue, the firm faces the loss and if it is vice versa, the firm earns the profit. When the nominal wages increase, it increases the cost of production. So at any given price point, the increase in the labor cost reduces the profitability of the firm because it increases the total cost of production of the firm.
Concept introduction:
Aggregate demand curve: It is the curve that shows the relationship between the price level in the economy and the quantity of real GDP demanded by the economic agents such as the households, firms, and the government.
Aggregate supply curve: In the short run, it is a curve that shows the relationship between the price level in the economy and the supply in the economy by the firms. In the long run, it shows the relationship between the price level and the level of quantity supplied by the firms.
Equilibrium: The equilibrium in the economy is the point where the economy's aggregate demand curve and the aggregate supply curve intersect with each other. There will be no excess demand or excess supply in the economy at the equilibrium.
Sub part (d):
Impact of different views on inflation on the economy's equilibrium.
Sub part (d):
Explanation of Solution
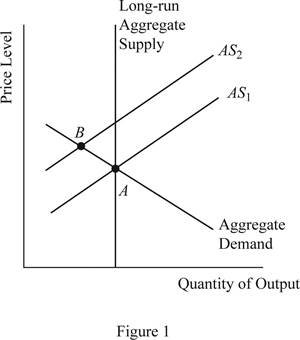
When the profitability of the firm decreases due to the increased nominal wage rate of the labor, the supply will decline in the economy, which will cause the short run aggregate supply curve to shift upward and this can be illustrated on the graph as follows:
Concept introduction:
Aggregate demand curve: It is the curve that shows the relationship between the price level in the economy and the quantity of real GDP demanded by the economic agents such as the households, firms, and the government.
Aggregate supply curve: In the short run, it is a curve that shows the relationship between the price level in the economy and the supply in the economy by the firms. In the long run, it shows the relationship between the price level and the level of quantity supplied by the firms.
Equilibrium: The equilibrium in the economy is the point where the economy's aggregate demand curve and the aggregate supply curve intersect with each other. There will be no excess demand or excess supply in the economy at the equilibrium.
Sub part (e):
Impact of different views on inflation on the economy's equilibrium.
Sub part (e):
Explanation of Solution
When the aggregate demand is held constant without any change and the aggregate supply shifts to AS2 as given above, it will lead to lower output in the economy along with higher price level in the economy. This is because when the SRAS curve shifts upward, the new equilibrium will be derived at point B, which is lying above and leftward to the initial equilibrium point A.
Concept introduction:
Aggregate demand curve: It is the curve that shows the relationship between the price level in the economy and the quantity of real GDP demanded by the economic agents such as the households, firms, and the government.
Aggregate supply curve: In the short run, it is a curve that shows the relationship between the price level in the economy and the supply in the economy by the firms. In the long run, it shows the relationship between the price level and the level of quantity supplied by the firms.
Equilibrium: The equilibrium in the economy is the point where the economy's aggregate demand curve and the aggregate supply curve intersect with each other. There will be no excess demand or excess supply in the economy at the equilibrium.
Sub part (f):
Impact of different views on inflation on the economy's equilibrium.
Sub part (f):
Explanation of Solution
The situation explained above that the total output of the economy falls, whereas the price level in the economy increases leading to the situation of stagflation and this means that the appointment choice of the new chairman was not a wise choice.
Concept introduction:
Aggregate demand curve: It is the curve that shows the relationship between the price level in the economy and the quantity of real GDP demanded by the economic agents such as the households, firms, and the government.
Aggregate supply curve: In the short run, it is a curve that shows the relationship between the price level in the economy and the supply in the economy by the firms. In the long run, it shows the relationship between the price level and the level of quantity supplied by the firms.
Equilibrium: The equilibrium in the economy is the point where the economy's aggregate demand curve and the aggregate supply curve intersect with each other. There will be no excess demand or excess supply in the economy at the equilibrium.
Want to see more full solutions like this?
Chapter 15 Solutions
Brief Principles of Macroeconomics (MindTap Course List)

- You are the manager of a large automobile dealership who wants to learn more about the effective- ness of various discounts offered to customers over the past 14 months. Following are the average negotiated prices for each month and the quantities sold of a basic model (adjusted for various options) over this period of time. 1. Graph this information on a scatter plot. Estimate the demand equation. What do the regression results indicate about the desirability of discounting the price? Explain. Month Price Quantity Jan. 12,500 15 Feb. 12,200 17 Mar. 11,900 16 Apr. 12,000 18 May 11,800 20 June 12,500 18 July 11,700 22 Aug. 12,100 15 Sept. 11,400 22 Oct. 11,400 25 Nov. 11,200 24 Dec. 11,000 30 Jan. 10,800 25 Feb. 10,000 28 2. What other factors besides price might be included in this equation? Do you foresee any difficulty in obtaining these additional data or incorporating them in the regression analysis?arrow_forwardsimple steps on how it should look like on excelarrow_forwardConsider options on a stock that does not pay dividends.The stock price is $100 per share, and the risk-free interest rate is 10%.Thestock moves randomly with u=1.25and d=1/u Use Excel to calculate the premium of a10-year call with a strike of $100.arrow_forward
- Please solve this, no words or explanations.arrow_forward17. Given that C=$700+0.8Y, I=$300, G=$600, what is Y if Y=C+I+G?arrow_forwardUse the Feynman technique throughout. Assume that you’re explaining the answer to someone who doesn’t know the topic at all. Write explanation in paragraphs and if you use currency use USD currency: 10. What is the mechanism or process that allows the expenditure multiplier to “work” in theKeynesian Cross Model? Explain and show both mathematically and graphically. What isthe underpinning assumption for the process to transpire?arrow_forward
- Use the Feynman technique throughout. Assume that you’reexplaining the answer to someone who doesn’t know the topic at all. Write it all in paragraphs: 2. Give an overview of the equation of exchange (EoE) as used by Classical Theory. Now,carefully explain each variable in the EoE. What is meant by the “quantity theory of money”and how is it different from or the same as the equation of exchange?arrow_forwardZbsbwhjw8272:shbwhahwh Zbsbwhjw8272:shbwhahwh Zbsbwhjw8272:shbwhahwhZbsbwhjw8272:shbwhahwhZbsbwhjw8272:shbwhahwharrow_forwardUse the Feynman technique throughout. Assume that you’re explaining the answer to someone who doesn’t know the topic at all:arrow_forward
 Macroeconomics: Private and Public Choice (MindTa...EconomicsISBN:9781305506756Author:James D. Gwartney, Richard L. Stroup, Russell S. Sobel, David A. MacphersonPublisher:Cengage Learning
 Economics: Private and Public Choice (MindTap Cou...EconomicsISBN:9781305506725Author:James D. Gwartney, Richard L. Stroup, Russell S. Sobel, David A. MacphersonPublisher:Cengage Learning
 Exploring EconomicsEconomicsISBN:9781544336329Author:Robert L. SextonPublisher:SAGE Publications, Inc
 Economics (MindTap Course List)EconomicsISBN:9781337617383Author:Roger A. ArnoldPublisher:Cengage Learning