
Sub part (a):
Impact of different views on inflation on the economy's equilibrium.
Sub part (a):
Explanation of Solution
The supply is dependent upon the
The demand comes from all the economic agents such as the households, firms, and the government. The demand depends on the price level of the economy. The increase and decrease in the price level determine the level of demand in the economy. The aggregation of all the individual demands in the economy is known as the aggregate demand; thus, the aggregate demand explains the relationship between the general price level and the level of real
When the new chairman is one with the view that the inflation is not a big issue on the economy, the economy would identify the chairman as the silent supporter of the inflation, and they will expect that the chairman will not introduce the active policies to fight against and control the inflation in the economy. As a result, the public will expect that the rise in the inflation and the price level are likely to rise.
Concept introduction:
Aggregate demand curve: It is the curve that shows the relationship between the price level in the economy and the quantity of real GDP demanded by the economic agents such as the households, firms, and the government.
Equilibrium: The equilibrium in the economy is the point where the economy's aggregate demand curve and the aggregate supply curve intersect with each other. There will be no excess demand or
Sub part (b):
Impact of different views on inflation on the economy's equilibrium.
Sub part (b):
Explanation of Solution
When the people expect higher inflation for the next year, they will start to calculate the changes in the price level. According to the expected higher level of inflation over the next year, they will expect higher cost of living for the next year. As a result of this, they will demand higher nominal wage rate for the next year with the employers.
Concept introduction:
Aggregate demand curve: It is the curve that shows the relationship between the price level in the economy and the quantity of real GDP demanded by the economic agents such as the households, firms, and the government.
Aggregate supply curve: In the short run, it is a curve that shows the relationship between the price level in the economy and the supply in the economy by the firms. In the long run, it shows the relationship between the price level and the level of quantity supplied by the firms.
Equilibrium: The equilibrium in the economy is the point where the economy's aggregate demand curve and the aggregate supply curve intersect with each other. There will be no excess demand or excess supply in the economy at the equilibrium.
Sub part (c):
Impact of different views on inflation on the economy's equilibrium.
Sub part (c):
Explanation of Solution
The profit of the firm is the difference between the total cost and the total revenue of the firm's products. When the total cost is higher than the total revenue, the firm faces the loss and if it is vice versa, the firm earns the profit. When the nominal wages increase, it increases the cost of production. So at any given price point, the increase in the labor cost reduces the profitability of the firm because it increases the total cost of production of the firm.
Concept introduction:
Aggregate demand curve: It is the curve that shows the relationship between the price level in the economy and the quantity of real GDP demanded by the economic agents such as the households, firms, and the government.
Aggregate supply curve: In the short run, it is a curve that shows the relationship between the price level in the economy and the supply in the economy by the firms. In the long run, it shows the relationship between the price level and the level of quantity supplied by the firms.
Equilibrium: The equilibrium in the economy is the point where the economy's aggregate demand curve and the aggregate supply curve intersect with each other. There will be no excess demand or excess supply in the economy at the equilibrium.
Sub part (d):
Impact of different views on inflation on the economy's equilibrium.
Sub part (d):
Explanation of Solution
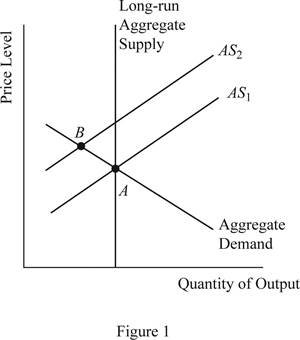
When the profitability of the firm decreases due to the increased nominal wage rate of the labor, the supply will decline in the economy, which will cause the short run aggregate supply curve to shift upward and this can be illustrated on the graph as follows:
Concept introduction:
Aggregate demand curve: It is the curve that shows the relationship between the price level in the economy and the quantity of real GDP demanded by the economic agents such as the households, firms, and the government.
Aggregate supply curve: In the short run, it is a curve that shows the relationship between the price level in the economy and the supply in the economy by the firms. In the long run, it shows the relationship between the price level and the level of quantity supplied by the firms.
Equilibrium: The equilibrium in the economy is the point where the economy's aggregate demand curve and the aggregate supply curve intersect with each other. There will be no excess demand or excess supply in the economy at the equilibrium.
Sub part (e):
Impact of different views on inflation on the economy's equilibrium.
Sub part (e):
Explanation of Solution
When the aggregate demand is held constant without any change and the aggregate supply shifts to AS2 as given above, it will lead to lower output in the economy along with higher price level in the economy. This is because when the SRAS curve shifts upward, the new equilibrium will be derived at point B, which is lying above and leftward to the initial equilibrium point A.
Concept introduction:
Aggregate demand curve: It is the curve that shows the relationship between the price level in the economy and the quantity of real GDP demanded by the economic agents such as the households, firms, and the government.
Aggregate supply curve: In the short run, it is a curve that shows the relationship between the price level in the economy and the supply in the economy by the firms. In the long run, it shows the relationship between the price level and the level of quantity supplied by the firms.
Equilibrium: The equilibrium in the economy is the point where the economy's aggregate demand curve and the aggregate supply curve intersect with each other. There will be no excess demand or excess supply in the economy at the equilibrium.
Sub part (f):
Impact of different views on inflation on the economy's equilibrium.
Sub part (f):
Explanation of Solution
The situation explained above that the total output of the economy falls, whereas the price level in the economy increases leading to the situation of stagflation and this means that the appointment choice of the new chairman was not a wise choice.
Concept introduction:
Aggregate demand curve: It is the curve that shows the relationship between the price level in the economy and the quantity of real GDP demanded by the economic agents such as the households, firms, and the government.
Aggregate supply curve: In the short run, it is a curve that shows the relationship between the price level in the economy and the supply in the economy by the firms. In the long run, it shows the relationship between the price level and the level of quantity supplied by the firms.
Equilibrium: The equilibrium in the economy is the point where the economy's aggregate demand curve and the aggregate supply curve intersect with each other. There will be no excess demand or excess supply in the economy at the equilibrium.
Want to see more full solutions like this?
Chapter 15 Solutions
EBK BRIEF PRINCIPLES OF MACROECONOMICS

- What is absolute advantage?arrow_forwardGood Day, Kindly requesting assistance with this also Briefly explain how elasticity affects government health policies in the following cases:● Taxes on unhealthy products (cigarettes, alcohol, sugary drinks)● Subsidizing Preventive Care (e.g., vaccines, screenings)● Drug Price Controls & Generic Substitutions● Co-Payments & Insurance Designarrow_forwardGood Day, Kindly assist with the following query: ● Cost–benefit Analysis● Cost-effectiveness analysis● Cost–utility analysis● Cost analysis or Cost Minimization Analysis For each of the following health policy questions listed below, identify and briefly explain which type of economic evaluation in question above would be most appropriate to use: ● The Ministry of Finance wants to know whether it is worth investing further resources into malaria control or building new primary schools? ● The Ministry of Health wants to compare the costs of receiving intravenous antibiotics in a hospital with receiving the same antibiotics (at the same doses) at home via a home health care service. ● The Ministry of Health wants to compare the costs and outcomes of two interventions for the treatment of early stage breast cancer: mastectomy without breast reconstruction compared to breast conserving surgery and radiotherapy (breast conservation). ● A malaria control programme wants to use economic…arrow_forward
- Substitute X=20. Can you show me how to do question 1 pleasearrow_forwardBlue Air Inc., has net sales of $740,000 and accounts receivables of $163,000. What is the firm's accounts receivables turnover?arrow_forwardPlease answer questions D-H, I have already answered A , B,C but it may help you to still solve them yourself. Thank you!arrow_forward
- 2. A firm’s production function is given by:Q = 10KLThe unit capital and labour costs are 2 and 1 pounds respectively. The firm is contracted to produce2000 units.(a) Write out the optimisation problem of the firm. (b) Express this problem using a Lagrangian function. (c) Find values of K and L which fulfil the contract with minimal cost to the firm. (d) Calculate the total cost to the firm.arrow_forward3. Consider the following estimated regression equation, estimated using a sample of firms, where RDis total firm spending on research and development in USD ($), Revenue is total firm revenuein USD ($), and W ages is the firms’ total spending on wages in USD ($) (standard errors inparentheses):RDd = 1000(600)+ 0.5(0.1)Revenue + 1.5(0.5)W ages,(a) Interpret the coefficients on each of the explanatory variables. (b) Which of the three coefficients are statistically significant at the 5% level of significance? Howdo you know? A researcher runs a two-sided statistical test of the null hypothesis that both the coefficients onthe explanatory variables above are jointly equal to 0.25 (mathematically, that β1 = β2 = 0.25),and reports a p-value of 0.045.(c) What does this p-value mean for the outcome of the test? (d) What would an appropriate two-sided alternative hypothesis look like?arrow_forward4. Consider the following regression equation, where Google is equal to 1 if an individual in thesample has worked at Google and 0 otherwise, and Earnings is annual earnings in thousands ofpounds (standard errors in parentheses):Earnings \ = 25000(12.5)+ 42000(7.0)Google,(a) Interpret the coefficient on Google.(b) Is the coefficient on Google statistically significant at the 5% level? How do you know?(c) Suppose that instead of Google we had used a variable called NeverGoogle, equal to 1 if anindividual has never worked at Google and 0 otherwise. (i) How would the slope coefficientchange? (ii) What would happen to the intercept? (d) What prevents us from interpreting the coefficient on Google as a causal effect? Give examplesin your answer.arrow_forward
- 4. Examine the regression table below before answering the questions that follow.Throughout, the Log() function represents the natural logarithm, so that Log(e) =1:Dependent Variable: Log(Expenditures on Cigarettes + 1)Method: Least SquaresVariable Coefficient Std. ErrorConstant 0.50 0.41Log(Income+1) −0.02 0.002(a) Why are the dependent and explanatory variables in the form log(1+x), ratherthan log(x)? (b) Which of the above coefficients are statistically significant? How do you know?(c) Interpret the coefficient on Log(Income+1). (d) What is the predicted level of Log(Expenditures on Cigarettes + 1) for anobserved individual with income of e10 − 1? (4arrow_forward3. Consider the following three (fictional) data points:Country Ultima Thule Narnia NeverlandGDP per capita (US $, 2021, in thousands) 10 30 20Deaths from COVID-19 as of Jan. 2023, millions 0.24 0.16 0.05(a) What is the slope of the line of best fit through these three points, whereDeaths from COVID-19 is the dependent variable and GDP per capita is theexplanatory variable? (b) The standard error for the slope parameter is 0.009. What does this standarderror measure? (c) Is the slope parameter statistically significant at the 5% level of significance?(The relevant critical value is not the usual value, but 4.303, due to the tinysample size). Explain what this means. (d) Why might this slope parameter be a misleading indicator of the relationshipbetween these two variables?arrow_forwardConsider the following estimated regression equation, where both Rent and Earnings aremeasured in pounds (£) at the individual level (standard errors in parentheses):log(\Rent) = 6.9(0.69)+ 0.9(0.3)log(Earnings),(a) Interpret the coefficient on log(Earnings). (b) If we divided Earnings by 1000, so that it is measured in 1000s of pounds instead of pounds,how would (i) the slope, (ii) the intercept change in the above equation? Now suppose the variable London is added, which is equal to one if an individual iives inLondon, and zero otherwise. The estimated regression equation changes to:log(\Rent) = 6.22(0.622)+ 0.5(0.05)log(Earnings) + 2(0.5)London,(c) Interpret the coefficient on London. (d) Explain why the coefficient on log(Earnings) when London is included in the regression andthe coefficient on log(Earnings) when London is not included in the regression are not thesame.arrow_forward
 Macroeconomics: Private and Public Choice (MindTa...EconomicsISBN:9781305506756Author:James D. Gwartney, Richard L. Stroup, Russell S. Sobel, David A. MacphersonPublisher:Cengage Learning
 Economics: Private and Public Choice (MindTap Cou...EconomicsISBN:9781305506725Author:James D. Gwartney, Richard L. Stroup, Russell S. Sobel, David A. MacphersonPublisher:Cengage Learning
 Exploring EconomicsEconomicsISBN:9781544336329Author:Robert L. SextonPublisher:SAGE Publications, Inc
 Economics (MindTap Course List)EconomicsISBN:9781337617383Author:Roger A. ArnoldPublisher:Cengage Learning