
Sub part (a):
Impact of different views on inflation on the economy's equilibrium.
Sub part (a):
Explanation of Solution
The supply is dependent upon the
The
When the new chairman is one with the view that the inflation is not a big issue on the economy, the economy would identify the chairman as the silent supporter of the inflation, and they will expect that the chairman will not introduce the active policies to fight against and control the inflation in the economy. As a result, the public will expect that the rise in the inflation and the price level are likely to rise.
Concept introduction:
Aggregate demand curve: It is the curve that shows the relationship between the price level in the economy and the quantity of real GDP demanded by the economic agents such as the households, firms, and the government.
Equilibrium: The equilibrium in the economy is the point where the economy's aggregate demand curve and the aggregate supply curve intersect with each other. There will be no excess demand or
Sub part (b):
Impact of different views on inflation on the economy's equilibrium.
Sub part (b):
Explanation of Solution
When the people expect higher inflation for the next year, they will start to calculate the changes in the price level. According to the expected higher level of inflation over the next year, they will expect higher cost of living for the next year. As a result of this, they will demand higher nominal wage rate for the next year with the employers.
Concept introduction:
Aggregate demand curve: It is the curve that shows the relationship between the price level in the economy and the quantity of real GDP demanded by the economic agents such as the households, firms, and the government.
Aggregate supply curve: In the short run, it is a curve that shows the relationship between the price level in the economy and the supply in the economy by the firms. In the long run, it shows the relationship between the price level and the level of quantity supplied by the firms.
Equilibrium: The equilibrium in the economy is the point where the economy's aggregate demand curve and the aggregate supply curve intersect with each other. There will be no excess demand or excess supply in the economy at the equilibrium.
Sub part (c):
Impact of different views on inflation on the economy's equilibrium.
Sub part (c):
Explanation of Solution
The profit of the firm is the difference between the total cost and the total revenue of the firm's products. When the total cost is higher than the total revenue, the firm faces the loss and if it is vice versa, the firm earns the profit. When the nominal wages increase, it increases the cost of production. So at any given price point, the increase in the labor cost reduces the profitability of the firm because it increases the total cost of production of the firm.
Concept introduction:
Aggregate demand curve: It is the curve that shows the relationship between the price level in the economy and the quantity of real GDP demanded by the economic agents such as the households, firms, and the government.
Aggregate supply curve: In the short run, it is a curve that shows the relationship between the price level in the economy and the supply in the economy by the firms. In the long run, it shows the relationship between the price level and the level of quantity supplied by the firms.
Equilibrium: The equilibrium in the economy is the point where the economy's aggregate demand curve and the aggregate supply curve intersect with each other. There will be no excess demand or excess supply in the economy at the equilibrium.
Sub part (d):
Impact of different views on inflation on the economy's equilibrium.
Sub part (d):
Explanation of Solution
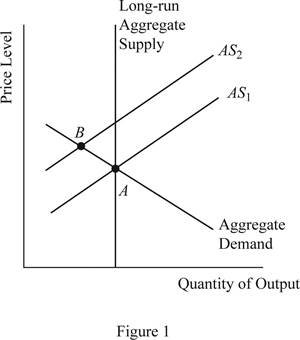
When the profitability of the firm decreases due to the increased nominal wage rate of the labor, the supply will decline in the economy, which will cause the short run aggregate supply curve to shift upward and this can be illustrated on the graph as follows:
Concept introduction:
Aggregate demand curve: It is the curve that shows the relationship between the price level in the economy and the quantity of real GDP demanded by the economic agents such as the households, firms, and the government.
Aggregate supply curve: In the short run, it is a curve that shows the relationship between the price level in the economy and the supply in the economy by the firms. In the long run, it shows the relationship between the price level and the level of quantity supplied by the firms.
Equilibrium: The equilibrium in the economy is the point where the economy's aggregate demand curve and the aggregate supply curve intersect with each other. There will be no excess demand or excess supply in the economy at the equilibrium.
Sub part (e):
Impact of different views on inflation on the economy's equilibrium.
Sub part (e):
Explanation of Solution
When the aggregate demand is held constant without any change and the aggregate supply shifts to AS2 as given above, it will lead to lower output in the economy along with higher price level in the economy. This is because when the SRAS curve shifts upward, the new equilibrium will be derived at point B, which is lying above and leftward to the initial equilibrium point A.
Concept introduction:
Aggregate demand curve: It is the curve that shows the relationship between the price level in the economy and the quantity of real GDP demanded by the economic agents such as the households, firms, and the government.
Aggregate supply curve: In the short run, it is a curve that shows the relationship between the price level in the economy and the supply in the economy by the firms. In the long run, it shows the relationship between the price level and the level of quantity supplied by the firms.
Equilibrium: The equilibrium in the economy is the point where the economy's aggregate demand curve and the aggregate supply curve intersect with each other. There will be no excess demand or excess supply in the economy at the equilibrium.
Sub part (f):
Impact of different views on inflation on the economy's equilibrium.
Sub part (f):
Explanation of Solution
The situation explained above that the total output of the economy falls, whereas the price level in the economy increases leading to the situation of stagflation and this means that the appointment choice of the new chairman was not a wise choice.
Concept introduction:
Aggregate demand curve: It is the curve that shows the relationship between the price level in the economy and the quantity of real GDP demanded by the economic agents such as the households, firms, and the government.
Aggregate supply curve: In the short run, it is a curve that shows the relationship between the price level in the economy and the supply in the economy by the firms. In the long run, it shows the relationship between the price level and the level of quantity supplied by the firms.
Equilibrium: The equilibrium in the economy is the point where the economy's aggregate demand curve and the aggregate supply curve intersect with each other. There will be no excess demand or excess supply in the economy at the equilibrium.
Want to see more full solutions like this?
Chapter 15 Solutions
Study Guide for Mankiw's Brief Principles of Macroeconomics, 7th

- a-c pleasearrow_forwardd-farrow_forwardPART II: Multipart Problems wood or solem of triflussd aidi 1. Assume that a society has a polluting industry comprising two firms, where the industry-level marginal abatement cost curve is given by: MAC = 24 - ()E and the marginal damage function is given by: MDF = 2E. What is the efficient level of emissions? b. What constant per-unit emissions tax could achieve the efficient emissions level? points) c. What is the net benefit to society of moving from the unregulated emissions level to the efficient level? In response to industry complaints about the costs of the tax, a cap-and-trade program is proposed. The marginal abatement cost curves for the two firms are given by: MAC=24-E and MAC2 = 24-2E2. d. How could a cap-and-trade program that achieves the same level of emissions as the tax be designed to reduce the costs of regulation to the two firms?arrow_forward
- Only #4 please, Use a graph please if needed to help provearrow_forwarda-carrow_forwardFor these questions, you must state "true," "false," or "uncertain" and argue your case (roughly 3 to 5 sentences). When appropriate, the use of graphs will make for stronger answers. Credit will depend entirely on the quality of your explanation. 1. If the industry facing regulation for its pollutant emissions has a lot of political capital, direct regulatory intervention will be more viable than an emissions tax to address this market failure. 2. A stated-preference method will provide a measure of the value of Komodo dragons that is more accurate than the value estimated through application of the travel cost model to visitation data for Komodo National Park in Indonesia. 3. A correlation between community demographics and the present location of polluting facilities is sufficient to claim a violation of distributive justice. olsvrc Q 4. When the damages from pollution are uncertain, a price-based mechanism is best equipped to manage the costs of the regulator's imperfect…arrow_forward
- For environmental economics, question number 2 only please-- thank you!arrow_forwardFor these questions, you must state "true," "false," or "uncertain" and argue your case (roughly 3 to 5 sentences). When appropriate, the use of graphs will make for stronger answers. Credit will depend entirely on the quality of your explanation. 1. If the industry facing regulation for its pollutant emissions has a lot of political capital, direct regulatory intervention will be more viable than an emissions tax to address this market failure. cullog iba linevoz ve bubivorearrow_forwardExercise 3 The production function of a firm is described by the following equation Q=10,000-3L2 where L stands for the units of labour. a) Draw a graph for this equation. Use the quantity produced in the y-axis, and the units of labour in the x-axis. b) What is the maximum production level? c) How many units of labour are needed at that point? d) Provide one reference with you answer.arrow_forward
- Exercise 1 Consider the market supply curve which passes through the intercept and from which the market equilibrium data is known, this is, the price and quantity of equilibrium PE=50 and QE=2000. Considering those two points, find the equation of the supply. Draw a graph of this line. Provide one reference with your answer. Exercise 2 Considering the previous supply line, determine if the following demand function corresponds to the market demand equilibrium stated above. QD=3000-2p.arrow_forwardConsider the market supply curve which passes through the intercept and from which the marketequilibrium data is known, this is, the price and quantity of equilibrium PE=50 and QE=2000.a. Considering those two points, find the equation of the supply. b. Draw a graph of this line.arrow_forwardGovernment Purchases and Tax Revenues A B GDP T₂ Refer to the diagram. Discretionary fiscal policy designed to slow the economy is illustrated by Multiple Choice the shift of curve T₁ to T2. a movement from d to balong curve T₁.arrow_forward
 Macroeconomics: Private and Public Choice (MindTa...EconomicsISBN:9781305506756Author:James D. Gwartney, Richard L. Stroup, Russell S. Sobel, David A. MacphersonPublisher:Cengage Learning
 Economics: Private and Public Choice (MindTap Cou...EconomicsISBN:9781305506725Author:James D. Gwartney, Richard L. Stroup, Russell S. Sobel, David A. MacphersonPublisher:Cengage Learning
 Exploring EconomicsEconomicsISBN:9781544336329Author:Robert L. SextonPublisher:SAGE Publications, Inc
 Economics (MindTap Course List)EconomicsISBN:9781337617383Author:Roger A. ArnoldPublisher:Cengage Learning