
Sub part (a):
Impact of different views on inflation on the economy's equilibrium.
Sub part (a):
Explanation of Solution
The supply is dependent upon the
The
When the new chairman is one with the view that the inflation is not a big issue on the economy, the economy would identify the chairman as the silent supporter of the inflation, and they will expect that the chairman will not introduce the active policies to fight against and control the inflation in the economy. As a result, the public will expect that the rise in the inflation and the price level are likely to rise.
Concept introduction:
Aggregate demand curve: It is the curve that shows the relationship between the price level in the economy and the quantity of real GDP demanded by the economic agents such as the households, firms, and the government.
Equilibrium: The equilibrium in the economy is the point where the economy's aggregate demand curve and the aggregate supply curve intersect with each other. There will be no excess demand or
Sub part (b):
Impact of different views on inflation on the economy's equilibrium.
Sub part (b):
Explanation of Solution
When the people expect higher inflation for the next year, they will start to calculate the changes in the price level. According to the expected higher level of inflation over the next year, they will expect higher cost of living for the next year. As a result of this, they will demand higher nominal wage rate for the next year with the employers.
Concept introduction:
Aggregate demand curve: It is the curve that shows the relationship between the price level in the economy and the quantity of real GDP demanded by the economic agents such as the households, firms, and the government.
Aggregate supply curve: In the short run, it is a curve that shows the relationship between the price level in the economy and the supply in the economy by the firms. In the long run, it shows the relationship between the price level and the level of quantity supplied by the firms.
Equilibrium: The equilibrium in the economy is the point where the economy's aggregate demand curve and the aggregate supply curve intersect with each other. There will be no excess demand or excess supply in the economy at the equilibrium.
Sub part (c):
Impact of different views on inflation on the economy's equilibrium.
Sub part (c):
Explanation of Solution
The profit of the firm is the difference between the total cost and the total revenue of the firm's products. When the total cost is higher than the total revenue, the firm faces the loss and if it is vice versa, the firm earns the profit. When the nominal wages increase, it increases the cost of production. So at any given price point, the increase in the labor cost reduces the profitability of the firm because it increases the total cost of production of the firm.
Concept introduction:
Aggregate demand curve: It is the curve that shows the relationship between the price level in the economy and the quantity of real GDP demanded by the economic agents such as the households, firms, and the government.
Aggregate supply curve: In the short run, it is a curve that shows the relationship between the price level in the economy and the supply in the economy by the firms. In the long run, it shows the relationship between the price level and the level of quantity supplied by the firms.
Equilibrium: The equilibrium in the economy is the point where the economy's aggregate demand curve and the aggregate supply curve intersect with each other. There will be no excess demand or excess supply in the economy at the equilibrium.
Sub part (d):
Impact of different views on inflation on the economy's equilibrium.
Sub part (d):
Explanation of Solution
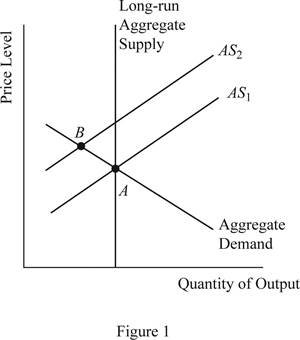
When the profitability of the firm decreases due to the increased nominal wage rate of the labor, the supply will decline in the economy, which will cause the short run aggregate supply curve to shift upward and this can be illustrated on the graph as follows:
Concept introduction:
Aggregate demand curve: It is the curve that shows the relationship between the price level in the economy and the quantity of real GDP demanded by the economic agents such as the households, firms, and the government.
Aggregate supply curve: In the short run, it is a curve that shows the relationship between the price level in the economy and the supply in the economy by the firms. In the long run, it shows the relationship between the price level and the level of quantity supplied by the firms.
Equilibrium: The equilibrium in the economy is the point where the economy's aggregate demand curve and the aggregate supply curve intersect with each other. There will be no excess demand or excess supply in the economy at the equilibrium.
Sub part (e):
Impact of different views on inflation on the economy's equilibrium.
Sub part (e):
Explanation of Solution
When the aggregate demand is held constant without any change and the aggregate supply shifts to AS2 as given above, it will lead to lower output in the economy along with higher price level in the economy. This is because when the SRAS curve shifts upward, the new equilibrium will be derived at point B, which is lying above and leftward to the initial equilibrium point A.
Concept introduction:
Aggregate demand curve: It is the curve that shows the relationship between the price level in the economy and the quantity of real GDP demanded by the economic agents such as the households, firms, and the government.
Aggregate supply curve: In the short run, it is a curve that shows the relationship between the price level in the economy and the supply in the economy by the firms. In the long run, it shows the relationship between the price level and the level of quantity supplied by the firms.
Equilibrium: The equilibrium in the economy is the point where the economy's aggregate demand curve and the aggregate supply curve intersect with each other. There will be no excess demand or excess supply in the economy at the equilibrium.
Sub part (f):
Impact of different views on inflation on the economy's equilibrium.
Sub part (f):
Explanation of Solution
The situation explained above that the total output of the economy falls, whereas the price level in the economy increases leading to the situation of stagflation and this means that the appointment choice of the new chairman was not a wise choice.
Concept introduction:
Aggregate demand curve: It is the curve that shows the relationship between the price level in the economy and the quantity of real GDP demanded by the economic agents such as the households, firms, and the government.
Aggregate supply curve: In the short run, it is a curve that shows the relationship between the price level in the economy and the supply in the economy by the firms. In the long run, it shows the relationship between the price level and the level of quantity supplied by the firms.
Equilibrium: The equilibrium in the economy is the point where the economy's aggregate demand curve and the aggregate supply curve intersect with each other. There will be no excess demand or excess supply in the economy at the equilibrium.
Want to see more full solutions like this?
Chapter 15 Solutions
EBK STUDY GUIDE FOR MANKIW'S BRIEF PRIN

- Consider the table on the right, which shows the various revenue concepts for a perfectly competitive firm. Suppose the firm faces a constant market price of $4. Compute first total revenue for each level of output and fill in the TR column of the table. Next, compute marginal revenue for each level of output and fill in the MR column of the table. (Marginal revenue at each level of output is computed using total revenue for two successive levels of output. For example, marginal revenue at 160 uses total revenue for output levels 120 and 160.) Total Marginal Price (p)Quantity (Q) Revenue (TR)Revenue (MR) $4 A EA 120 $4 160 $4 200 $4 240 $4 280 $ EA EA EA 10 S คarrow_forwardThis week we will be discussing measures of economic well-being. Read the following short article from the Office of National Statistics from the U.K. which discusses different measures of economic well-being: https://blog.ons.gov.uk/2017/07/06/beyond-gdp-measuring-the-economic-well-being-of-individuals/ For this assignment, we will narrow down to the economic well-being of the St. Louis region (or another region you choose). As the article indicates there are different measures of well-being. You are interested in creating a Hypothesis Test about the economic well-being of the area. Discuss the following issues: First, think about your research hypothesis and justify it briefly. Remember, a hypothesis is a well-thought and untested proposition. What is the null hypothesis? What is the parameter you are interested in? (i.e., the measure of well-being). Is it going to be a Lower-Tail, Upper-Tail or Two-Tailed test? What is the data that you need and how will you collect the data? What…arrow_forwardJohnny brought $39.50 to the art supply store. He bought a brush, a sketchbook, and a paint set. The brush was 1 6 as much as the sketchbook, and the sketchbook cost 3 4 the cost of the paint set. Johnny had $2.00 left over after buying these items.arrow_forward
- A young woman plans to retire early in 25 years. She believes she can save $10,000 each year starting now. If she plans to begin withdrawing money one year after she makes her last payment into the retirement account (i.e., in the 26th year), what uniform amount could she withdraw each year for 30 years, if the account earns an interest rate of 8% per year? a) Correctly plot the cash flow diagram with its respective vectors, arrowheads, units, and currency values. b) Correct mathematical approach and development, use of compound interest factors.c) Financial logic in the development of the exercise and application of the concept of time value of money. d) Final numerical answer and writing in prose with a minimum of 20 words and a maximum of 50 words of the obtained numerical interpretation.arrow_forwardA hospital charges $200 for a medical procedure, and 1,000 patients use the service. The hospital raises the price to $250, and the number of patients drops to 900. Calculate the price elasticity of demand (PED) and explain your answer. (show all working) Briefly explain how elasticity affects government health policies in the following cases: • Taxes on unhealthy products (cigarettes, alcohol, sugary drinks) • Subsidizing Preventive Care (e.g., vaccines, screenings) Drug Price Controls & Generic Substitutions Co-Payments & Insurance Designarrow_forwardAssume the United States is a large consumer of steel, able to influence the world price. DUS and SUS denote its demand and supply schedules in Figure 1. The overall (United States plus world) supply schedule of steel is denoted by SUS.+W. Figure 1 Import Tariff Levied by a Large Country Answer all questions (a-f) by referring to Figure 1 above. a) Calculate the free trade market equilibrium price, domestic consumption, and volumE Answer all questions (a-f) by referring to Figure 1 above. a) Calculate the free trade market equilibrium price, domestic consumption, and volume of steel imports by the US. [5 marks] b) Suppose the United States imposes a tariff (t) of $100 on each ton of steel imported. With the tariff, calculate the price of steel and the volume of steel imports by the US. [5 marks] c) Of the $100 tariff, how much is passed on to the US consumer via a higher price, and how much is borne by the foreign exporter? [5 marks] d) Calculate the tariff's deadweight welfare loss to…arrow_forward
- 1. A doctor quits his job, which pays $77,000 per annum, to open a non-governmental organization (NGO) to serve the needs of orphans. His annual expenses for the NGO amounts to $62,700 for food and daily supplies, $9,400 for maintenance, and $1,800 for books. What is his opportunity cost of opening the NGO? (Show working) 2. During the COVID-19 pandemic, hospitals worldwide faced severe resource constraints, including: a. Limited ICU beds b. Shortage of ventilators c. Insufficient doctors and nurses d. Lack of vaccines in early 2021 Governments and hospitals had to make critical decisions about who receives treatment first and how to allocate limited resources efficiently. In no more than 150 words and using core economic concepts of scarcity, choice and opportunity cost, how would you help your government make these critical decisions?arrow_forwardWhat is the argument about necessary evil?arrow_forwardWhat are the consequences of declining houses prices?arrow_forward
- Q1 Explain what economic catch 22 is. Q2 What are the consequences of declining houses pricing? Q3 What is the argument about necessary evil? Q4 Explain the idea of irrational exhuberance? Q5 Explain what was the economic paradox?arrow_forward< Files 9:10 Fri Mar 21 Chapter+11-Public+Goods+and+Common+Res... The Economic Catch-22 By Robert J. Samuelson We are now in the "blame phase" of the economic cycle. As the housing slump deepens and financial markets swing erratically, we've embarked on the usual search for culprits. Who got us into this mess? Our investigations will doubtlessly reveal, as they already have, much wishful thinking and miscalculation. They will also find incompetence, predatory behavior and probably some criminality. But let me suggest that, though inevitable and necessary, this exercise is also simplistic and deceptive. -- business It assumes that, absent mistakes and misdeeds, we might remain in a permanent paradise of powerful income and wealth growth. The reality, I think, is that the economy follows its own Catch-22: By taking prosperity for granted, people perversely subvert prosperity. The more we managers, investors, consumers - think that economic growth is guaranteed and that risk and…arrow_forward2.) Using the line drawing tool, plot and label the isocost line. Carefully follow the instructions above, and only draw the required objects. FILL IN BLANK d. Now suppose the price of labour rises to $5 per unit, but the firm still wants to produce 500 tires per day. Explain how a cost-minimizing firm adjusts to this change (with no change in technology). A cost-minimizing firm will be producing on ▼ The samedifferently slopedparallel isocost line. The firm will use ▼ moresameless labour and ▼ less the same amount of more capital and produce on ▼ a higher point on the same a lower point on the same a lower a higher isoquant curve.arrow_forward
 Macroeconomics: Private and Public Choice (MindTa...EconomicsISBN:9781305506756Author:James D. Gwartney, Richard L. Stroup, Russell S. Sobel, David A. MacphersonPublisher:Cengage Learning
 Economics: Private and Public Choice (MindTap Cou...EconomicsISBN:9781305506725Author:James D. Gwartney, Richard L. Stroup, Russell S. Sobel, David A. MacphersonPublisher:Cengage Learning
 Exploring EconomicsEconomicsISBN:9781544336329Author:Robert L. SextonPublisher:SAGE Publications, Inc
 Economics (MindTap Course List)EconomicsISBN:9781337617383Author:Roger A. ArnoldPublisher:Cengage Learning