The graph in Exercise 64 shows the number of student y enrolled in public colleges for selected years x , where x is the number of years since 1990. The table gives a partial list of data from the graph. a. Use the data in the table to find the least-squares regression line. Round the slope to 2 decimal places and the y -intercept to 1 decimal place. b. Use a graphing utility to graph the regression line and the observed data. c. Assuming that the linear trend continues use the model from part (a) to predict the number of students enrolled in public colleges for the year 2020. d. By how much do the results of part (c) differ from the result of Exercise 64(d)?
The graph in Exercise 64 shows the number of student y enrolled in public colleges for selected years x , where x is the number of years since 1990. The table gives a partial list of data from the graph. a. Use the data in the table to find the least-squares regression line. Round the slope to 2 decimal places and the y -intercept to 1 decimal place. b. Use a graphing utility to graph the regression line and the observed data. c. Assuming that the linear trend continues use the model from part (a) to predict the number of students enrolled in public colleges for the year 2020. d. By how much do the results of part (c) differ from the result of Exercise 64(d)?
Solution Summary: The author calculates the least squares regression line by rounding the slope to 2 decimal and y-intercept.
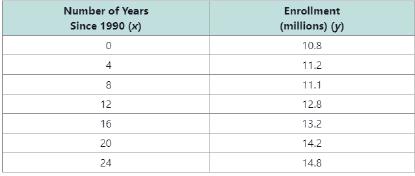
The graph in Exercise 64 shows the number of student y enrolled in public colleges for selected years x, where x is the number of years since 1990. The table gives a partial list of data from the graph.
a. Use the data in the table to find the least-squares regression line. Round the slope to 2 decimal places and the y-intercept to 1 decimal place.
b. Use a graphing utility to graph the regression line and the observed data.
c. Assuming that the linear trend continues use the model from part (a) to predict the number of students enrolled in public colleges for the year 2020.
d. By how much do the results of part (c) differ from the result of Exercise 64(d)?
University Calculus: Early Transcendentals (4th Edition)
Knowledge Booster
Learn more about
Need a deep-dive on the concept behind this application? Look no further. Learn more about this topic, calculus and related others by exploring similar questions and additional content below.
Correlation Vs Regression: Difference Between them with definition & Comparison Chart; Author: Key Differences;https://www.youtube.com/watch?v=Ou2QGSJVd0U;License: Standard YouTube License, CC-BY
Correlation and Regression: Concepts with Illustrative examples; Author: LEARN & APPLY : Lean and Six Sigma;https://www.youtube.com/watch?v=xTpHD5WLuoA;License: Standard YouTube License, CC-BY


 Glencoe Algebra 1, Student Edition, 9780079039897...AlgebraISBN:9780079039897Author:CarterPublisher:McGraw Hill
 Functions and Change: A Modeling Approach to Coll...AlgebraISBN:9781337111348Author:Bruce Crauder, Benny Evans, Alan NoellPublisher:Cengage Learning
 Elementary Linear Algebra (MindTap Course List)AlgebraISBN:9781305658004Author:Ron LarsonPublisher:Cengage Learning
 Big Ideas Math A Bridge To Success Algebra 1: Stu...AlgebraISBN:9781680331141Author:HOUGHTON MIFFLIN HARCOURTPublisher:Houghton Mifflin Harcourt