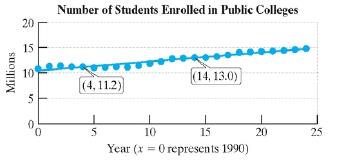
The graph shows the number of students enrolled in public colleges for selected years. The x variable represents the number of years since 1990 and the y variable represents the number of students (in millions). a. Use the points (4, 11.2) and (14, 13.0) to write a linear model for these data. b. Interpret the meaning of the slope in the context of this problem. c. Interpret the meaning of the y -intercept in the context of this problem. d. In the event that the linear trend continues beyond the last observed data point, use the model in part (a) to predict the number of students enrolled in public colleges for the year 2020.
The graph shows the number of students enrolled in public colleges for selected years. The x variable represents the number of years since 1990 and the y variable represents the number of students (in millions). a. Use the points (4, 11.2) and (14, 13.0) to write a linear model for these data. b. Interpret the meaning of the slope in the context of this problem. c. Interpret the meaning of the y -intercept in the context of this problem. d. In the event that the linear trend continues beyond the last observed data point, use the model in part (a) to predict the number of students enrolled in public colleges for the year 2020.
Solution Summary: The author calculates a linear model for the data in the graph shown below that shows the number of students enrolled in public colleges for selected years.
The graph shows the number of students enrolled in public colleges for selected years. The
x
variable represents the number of years since 1990 and the
y
variable represents the number of students (in millions).
a. Use the points (4, 11.2) and (14, 13.0) to write a linear model for these data.
b. Interpret the meaning of the slope in the context of this problem.
c. Interpret the meaning of the
y
-intercept
in the context of this problem.
d. In the event that the linear trend continues beyond the last observed data point, use the model in part (a) to predict the number of students enrolled in public colleges for the year 2020.
Use the properties of logarithms, given that In(2) = 0.6931 and In(3) = 1.0986, to approximate the logarithm. Use a calculator to confirm your approximations. (Round your answers to four decimal places.)
(a) In(0.75)
(b) In(24)
(c) In(18)
1
(d) In
≈
2
72
Find the indefinite integral. (Remember the constant of integration.)
√tan(8x)
tan(8x) sec²(8x) dx
Need a deep-dive on the concept behind this application? Look no further. Learn more about this topic, calculus and related others by exploring similar questions and additional content below.
Linear Equation | Solving Linear Equations | What is Linear Equation in one variable ?; Author: Najam Academy;https://www.youtube.com/watch?v=tHm3X_Ta_iE;License: Standard YouTube License, CC-BY


 Intermediate AlgebraAlgebraISBN:9781285195728Author:Jerome E. Kaufmann, Karen L. SchwittersPublisher:Cengage Learning
 Elementary AlgebraAlgebraISBN:9780998625713Author:Lynn Marecek, MaryAnne Anthony-SmithPublisher:OpenStax - Rice University
 Glencoe Algebra 1, Student Edition, 9780079039897...AlgebraISBN:9780079039897Author:CarterPublisher:McGraw Hill
 Algebra: Structure And Method, Book 1AlgebraISBN:9780395977224Author:Richard G. Brown, Mary P. Dolciani, Robert H. Sorgenfrey, William L. ColePublisher:McDougal Littell
 College Algebra (MindTap Course List)AlgebraISBN:9781305652231Author:R. David Gustafson, Jeff HughesPublisher:Cengage Learning