
Concept explainers
Videos
a.
Find the proportion of homes that have an attached garage.
Check whether people can conclude that more than 60% of the homes have an attached garage.
Find the p-value.
a.
Answer to Problem 62DA
The proportion of homes that have an attached garage is 0.7429.
Yes, people can conclude that more than 60% of the homes have an attached garage.
The p-value is 0.001.
Explanation of Solution
Calculation:
In this case, the test is to check whether more than 60% of the homes have an attached garage.
Let
The proportion of homes that have an attached garage is obtained as follows:
Thus, the proportion of homes that have an attached garage is 0.7429.
The level of significance is 0.05.
Therefore, the value of z score at 0.4500
Decision rule:
Reject the null hypothesis if z > 1.645.
The
Step-by-step procedure to find the test statistic using MINITAB software:
- Choose Stat > Basic Statistics > 1 Proportion.
- Choose Summarized data.
- In Number of events, enter 78. In Number of trials, enter 105.
- Enter Hypothesized proportion as 0.60.
- Check Options, enter Confidence level as 95.0.
- Choose greater than in alternative.
- Select Method as Normal approximation.
- Click OK in all dialogue boxes.
Output is obtained as follows:

Thus, the value of the test statistic is 2.99 and the p-value is 0.001.
In this case, the critical value is 1.645 and the test statistic is 2.99.
Here, the test statistic 2.99 is greater than the critical value 1.645.
That is, 2.99 > 1.645.
Therefore, reject the null hypothesis.
Therefore, people can conclude that more than 60% of the homes have an attached garage.
b.
Find the proportion of homes that have a pool.
Check whether people can conclude that more than 60% of the homes have a pool.
Find the p-value.
b.
Answer to Problem 62DA
The proportion of homes that have an attached garage is 0.6381.
Yes, people can conclude that more than 60% of the homes have a pool.
The p-value is 0.2119.
Explanation of Solution
Calculation:
In this case, the test is to check whether more than 60% of the homes have a pool.
Let
The proportion of homes that have an attached garage is obtained as follows:
Thus, the proportion of homes that have an attached garage is 0.6381.
The level of significance is 0.05.
Therefore, the value of z score at 0.4500
Decision rule:
Reject the null hypothesis if z > 1.645.
The sample size n is 100 and p is 0.60. Therefore, the number of events x is 78.
Step-by-step procedure to find the test statistic using MINITAB software:
- Choose Stat > Basic Statistics > 1 Proportion.
- Choose Summarized data.
- In Number of events, enter 67. In Number of trials, enter 105.
- Enter Hypothesized proportion as 0.60.
- Check Options, enter Confidence level as 95.0.
- Choose greater than in alternative.
- Select Method as Normal approximation.
- Click OK in all dialogue boxes.
Output is obtained as follows:
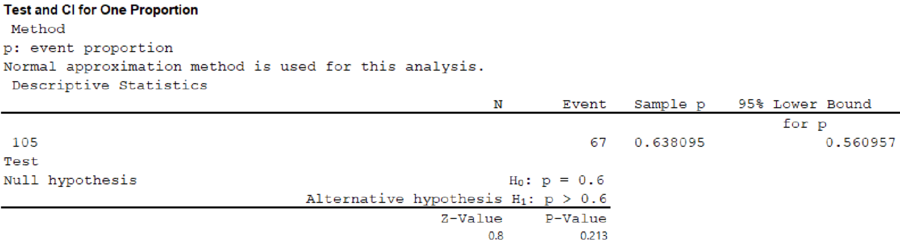
Thus, the value of the test statistic is 0.80 and the p-value is 0.213.
In this case, the critical value is 1.645 and the test statistic is 0.80.
Here, the test statistic 0.80 is less than the critical value 1.645.
That is, 0.80 < 1.645.
Therefore, do not reject the null hypothesis.
Therefore, people cannot conclude that more than 60% of the homes have a pool.
c.
Develop a
Check whether there is an association between the variables pool and township.
c.
Explanation of Solution
Calculation:
From the given information, the contingency table that shows whether a home has a pool and the township in which the house is located is shown below:
| Pool | Township | |||||
| 1 | 2 | 3 | 4 | 5 | Total | |
| No | 9 | 8 | 7 | 11 | 3 | 38 |
| Yes | 6 | 12 | 18 | 18 | 13 | 67 |
| Total | 15 | 20 | 25 | 29 | 16 | 105 |
The number of degrees of freedom is obtained as follows:
Therefore, the number of degrees of freedom is 4.
Step-by-step procedure to find the critical value using MINITAB software:
- Choose Graph > Probability Distribution Plot > View Probability > OK.
- From Distribution, choose ‘Chi-Square’ distribution.
- Enter Degrees of freedom is 4.
- Click the Shaded Area tab.
- Choose Probability and Right Tail for the region of the curve to shade.
- Enter the data value as 0.05.
- Click OK.
Output using MINITAB software is obtained as follows:
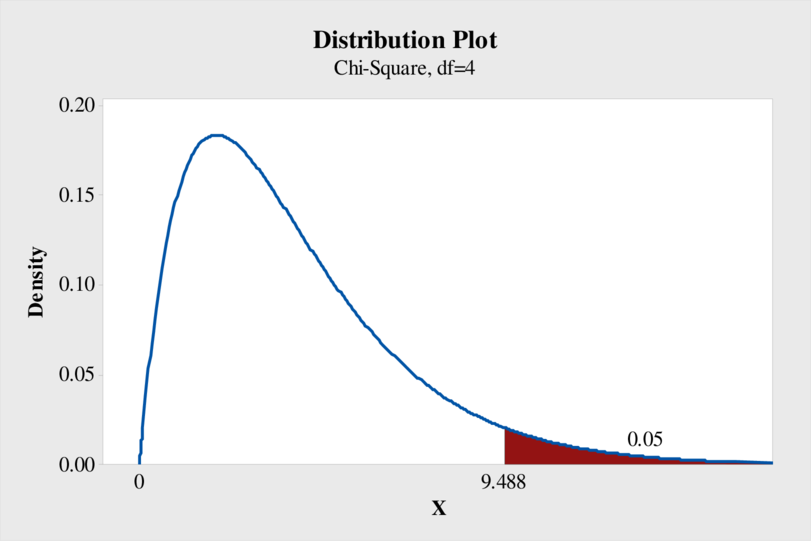
From the output, the critical value of chi-square is 9.488.
The general decision rule is reject the null hypothesis if
Therefore, the decision rule is reject the null hypothesis if
Test statistic:
Step-by-step procedure to find the test statistic using MINITAB software:
- Choose Stat > Tables > Chi-Square Test for Association.
- Choose Summarized data in a two-way table.
- In Columns containing the table, enter the columns of 1, 2, 3, 4 and 5.
- In Rows under Labels for the table, enter the column of Pool.
- Click OK.
Output is obtained as follows:
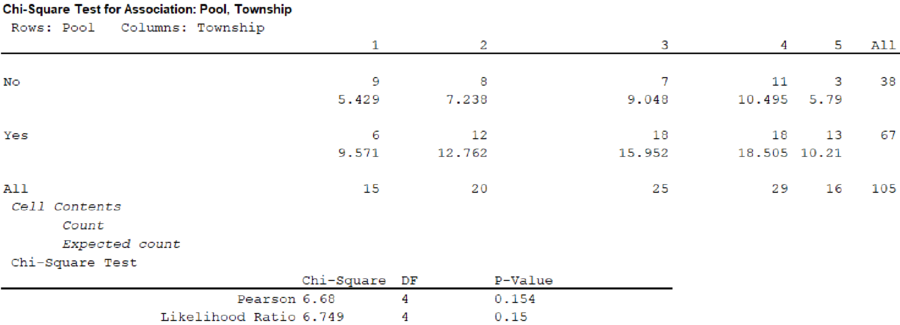
From the output, the test statistic is 6.68.
The critical value is 9.488.
Here, the test statistic is less than the critical value.
That is, 6.68 < 9.488.
Thus, do not reject the null hypothesis.
Therefore, there is no sufficient evidence to conclude that there is an association between the variables pool and township.
d.
Develop a contingency table that shows whether a home has an attached garage and the township in which the house is located.
Check whether there is an association between the variables attached garage and township.
d.
Explanation of Solution
Calculation:
From the given information, the contingency table that shows whether a home has an attached garage and the township in which the house is located is shown below:
| Garage | Township | |||||
| 1 | 2 | 3 | 4 | 5 | Total | |
| No | 6 | 6 | 6 | 6 | 3 | 27 |
| Yes | 9 | 14 | 19 | 23 | 13 | 78 |
| Total | 15 | 20 | 25 | 29 | 16 | 105 |
The number of degrees of freedom is obtained as follows:
Therefore, the number of degrees of freedom is 4.
Step-by-step procedure to find the critical value using MINITAB software:
- Choose Graph > Probability Distribution Plot > View Probability > OK.
- From Distribution, choose ‘Chi-Square’ distribution.
- Enter Degrees of freedom is 4.
- Click the Shaded Area tab.
- Choose Probability and Right Tail for the region of the curve to shade.
- Enter the data value as 0.05.
- Click OK.
Output using MINITAB software is obtained as follows:

From the output, the critical value of chi-square is 9.488.
The general decision rule is reject the null hypothesis if
Therefore, the decision rule is reject the null hypothesis if
Test statistic:
Step-by-step procedure to find the test statistic using MINITAB software:
- Choose Stat > Tables > Chi-Square Test for Association.
- Choose Summarized data in a two-way table.
- In Columns containing the table, enter the columns of 1, 2, 3, 4 and 5.
- In Rows under Labels for the table, enter the column of Garage.
- Click OK.
Output is obtained as follows:
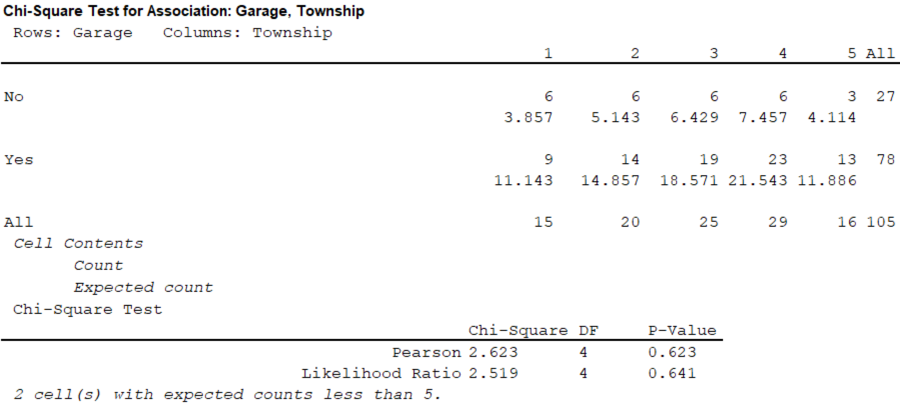
From the output, the test statistic is 2.623.
The critical value is 9.488.
Here, the test statistic is less than the critical value.
That is, 2.623 < 9.488.
Thus, do not reject the null hypothesis.
Therefore, there is no sufficient evidence to conclude that there is an association between the variables attached garage and township.
Want to see more full solutions like this?
Chapter 15 Solutions
Gen Combo Ll Statistical Techniques In Business And Economics; Connect Ac


- Please could you check my answersarrow_forwardLet Y₁, Y2,, Yy be random variables from an Exponential distribution with unknown mean 0. Let Ô be the maximum likelihood estimates for 0. The probability density function of y; is given by P(Yi; 0) = 0, yi≥ 0. The maximum likelihood estimate is given as follows: Select one: = n Σ19 1 Σ19 n-1 Σ19: n² Σ1arrow_forwardPlease could you help me answer parts d and e. Thanksarrow_forward
- When fitting the model E[Y] = Bo+B1x1,i + B2x2; to a set of n = 25 observations, the following results were obtained using the general linear model notation: and 25 219 10232 551 XTX = 219 10232 3055 133899 133899 6725688, XTY 7361 337051 (XX)-- 0.1132 -0.0044 -0.00008 -0.0044 0.0027 -0.00004 -0.00008 -0.00004 0.00000129, Construct a multiple linear regression model Yin terms of the explanatory variables 1,i, x2,i- a) What is the value of the least squares estimate of the regression coefficient for 1,+? Give your answer correct to 3 decimal places. B1 b) Given that SSR = 5550, and SST=5784. Calculate the value of the MSg correct to 2 decimal places. c) What is the F statistics for this model correct to 2 decimal places?arrow_forwardCalculate the sample mean and sample variance for the following frequency distribution of heart rates for a sample of American adults. If necessary, round to one more decimal place than the largest number of decimal places given in the data. Heart Rates in Beats per Minute Class Frequency 51-58 5 59-66 8 67-74 9 75-82 7 83-90 8arrow_forwardcan someone solvearrow_forward
- QUAT6221wA1 Accessibility Mode Immersiv Q.1.2 Match the definition in column X with the correct term in column Y. Two marks will be awarded for each correct answer. (20) COLUMN X Q.1.2.1 COLUMN Y Condenses sample data into a few summary A. Statistics measures Q.1.2.2 The collection of all possible observations that exist for the random variable under study. B. Descriptive statistics Q.1.2.3 Describes a characteristic of a sample. C. Ordinal-scaled data Q.1.2.4 The actual values or outcomes are recorded on a random variable. D. Inferential statistics 0.1.2.5 Categorical data, where the categories have an implied ranking. E. Data Q.1.2.6 A set of mathematically based tools & techniques that transform raw data into F. Statistical modelling information to support effective decision- making. 45 Q Search 28 # 00 8 LO 1 f F10 Prise 11+arrow_forwardStudents - Term 1 - Def X W QUAT6221wA1.docx X C Chat - Learn with Chegg | Cheg X | + w:/r/sites/TertiaryStudents/_layouts/15/Doc.aspx?sourcedoc=%7B2759DFAB-EA5E-4526-9991-9087A973B894% QUAT6221wA1 Accessibility Mode பg Immer The following table indicates the unit prices (in Rands) and quantities of three consumer products to be held in a supermarket warehouse in Lenasia over the time period from April to July 2025. APRIL 2025 JULY 2025 PRODUCT Unit Price (po) Quantity (q0)) Unit Price (p₁) Quantity (q1) Mineral Water R23.70 403 R25.70 423 H&S Shampoo R77.00 922 R79.40 899 Toilet Paper R106.50 725 R104.70 730 The Independent Institute of Education (Pty) Ltd 2025 Q Search L W f Page 7 of 9arrow_forwardCOM WIth Chegg Cheg x + w:/r/sites/TertiaryStudents/_layouts/15/Doc.aspx?sourcedoc=%7B2759DFAB-EA5E-4526-9991-9087A973B894%. QUAT6221wA1 Accessibility Mode Immersi The following table indicates the unit prices (in Rands) and quantities of three meals sold every year by a small restaurant over the years 2023 and 2025. 2023 2025 MEAL Unit Price (po) Quantity (q0)) Unit Price (P₁) Quantity (q₁) Lasagne R125 1055 R145 1125 Pizza R110 2115 R130 2195 Pasta R95 1950 R120 2250 Q.2.1 Using 2023 as the base year, compute the individual price relatives in 2025 for (10) lasagne and pasta. Interpret each of your answers. 0.2.2 Using 2023 as the base year, compute the Laspeyres price index for all of the meals (8) for 2025. Interpret your answer. Q.2.3 Using 2023 as the base year, compute the Paasche price index for all of the meals (7) for 2025. Interpret your answer. Q Search L O W Larrow_forward
- QUAI6221wA1.docx X + int.com/:w:/r/sites/TertiaryStudents/_layouts/15/Doc.aspx?sourcedoc=%7B2759DFAB-EA5E-4526-9991-9087A973B894%7 26 QUAT6221wA1 Q.1.1.8 One advantage of primary data is that: (1) It is low quality (2) It is irrelevant to the purpose at hand (3) It is time-consuming to collect (4) None of the other options Accessibility Mode Immersive R Q.1.1.9 A sample of fifteen apples is selected from an orchard. We would refer to one of these apples as: (2) ھا (1) A parameter (2) A descriptive statistic (3) A statistical model A sampling unit Q.1.1.10 Categorical data, where the categories do not have implied ranking, is referred to as: (2) Search D (2) 1+ PrtSc Insert Delete F8 F10 F11 F12 Backspace 10 ENG USarrow_forwardepoint.com/:w:/r/sites/TertiaryStudents/_layouts/15/Doc.aspx?sourcedoc=%7B2759DFAB-EA5E-4526-9991-9087A 23;24; 25 R QUAT6221WA1 Accessibility Mode DE 2025 Q.1.1.4 Data obtained from outside an organisation is referred to as: (2) 45 (1) Outside data (2) External data (3) Primary data (4) Secondary data Q.1.1.5 Amongst other disadvantages, which type of data may not be problem-specific and/or may be out of date? W (2) E (1) Ordinal scaled data (2) Ratio scaled data (3) Quantitative, continuous data (4) None of the other options Search F8 F10 PrtSc Insert F11 F12 0 + /1 Backspaarrow_forward/r/sites/TertiaryStudents/_layouts/15/Doc.aspx?sourcedoc=%7B2759DFAB-EA5E-4526-9991-9087A973B894%7D&file=Qu Q.1.1.14 QUAT6221wA1 Accessibility Mode Immersive Reader You are the CFO of a company listed on the Johannesburg Stock Exchange. The annual financial statements published by your company would be viewed by yourself as: (1) External data (2) Internal data (3) Nominal data (4) Secondary data Q.1.1.15 Data relevancy refers to the fact that data selected for analysis must be: (2) Q Search (1) Checked for errors and outliers (2) Obtained online (3) Problem specific (4) Obtained using algorithms U E (2) 100% 高 W ENG A US F10 点 F11 社 F12 PrtSc 11 + Insert Delete Backspacearrow_forward
 Glencoe Algebra 1, Student Edition, 9780079039897...AlgebraISBN:9780079039897Author:CarterPublisher:McGraw Hill
 Holt Mcdougal Larson Pre-algebra: Student Edition...AlgebraISBN:9780547587776Author:HOLT MCDOUGALPublisher:HOLT MCDOUGAL
 College Algebra (MindTap Course List)AlgebraISBN:9781305652231Author:R. David Gustafson, Jeff HughesPublisher:Cengage Learning
 Big Ideas Math A Bridge To Success Algebra 1: Stu...AlgebraISBN:9781680331141Author:HOUGHTON MIFFLIN HARCOURTPublisher:Houghton Mifflin Harcourt
