Pathways to Math Literacy with 18 Week ALEKS Access Card
1st Edition
ISBN: 9781259278723
Author: David Sobecki Professor, Brian A. Mercer
Publisher: McGraw-Hill Education
expand_more
expand_more
format_list_bulleted
Videos
Question
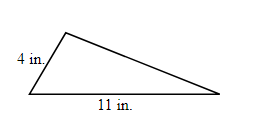
Chapter 1.5, Problem 5A
To determine
To calculate: The length of the unlabelled side of the provided triangle if the perimeter is
Expert Solution & Answer
Want to see the full answer?
Check out a sample textbook solution
Students have asked these similar questions
When fitting the model E[Y] = Bo+B1x1,i + B2x2; to a set of n = 25 observations, the following results were obtained using the general linear model notation:
and
25
219
10232
551
XTX =
219
10232
3055 133899
133899 6725688,
XTY
7361
337051
(XX)--
0.1132 -0.0044 -0.00008
-0.0044 0.0027 -0.00004
-0.00008 -0.00004 0.00000129,
Construct a multiple linear regression model Yin terms of the explanatory variables 1,i, x2,i-
a) What is the value of the least squares estimate of the regression coefficient for 1,+? Give your answer correct to 3 decimal places.
B1
b) Given that SSR = 5550, and SST=5784. Calculate the value of the MSg correct to 2 decimal places.
c) What is the F statistics for this model correct to 2 decimal places?
Wed Mar 26
13
14
Quiz
E
Finding Missing Sides and Angle Practice
Numeric 2 points
Find PS.
P
Q
39
R
28°
76°
13
S
Numeric 2 points
Find the measure of angle CDB.
R
2e
dx
e2x
ex+1
Chapter 1 Solutions
Pathways to Math Literacy with 18 Week ALEKS Access Card
Ch. 1.1 - After reading the opening paragraph, what do you...Ch. 1.1 - Count the number of spaces containing each letter...Ch. 1.1 - Prob. 2CCh. 1.1 - Prob. 4CCh. 1.1 - Prob. 5CCh. 1.1 - Prob. 7CCh. 1.1 - Prob. 8CCh. 1.1 - Prob. 3GCh. 1.1 - Prob. 4GCh. 1.1 - Prob. 5G
Ch. 1.1 - To create a pie chart in Excel: Type the category...Ch. 1.1 - To create a pie chart in Excel: Type the category...Ch. 1.1 - To create a pie chart in Excel: Use the mouse to...Ch. 1.1 - To create a pie chart in Excel: With the...Ch. 1.2 - Prob. 1GCh. 1.2 - Prob. 2GCh. 1.2 - Prob. 3GCh. 1.2 - Prob. 4GCh. 1.2 - Prob. 5GCh. 1.2 - Prob. 6GCh. 1.2 - Prob. 7GCh. 1.2 - Prob. 8GCh. 1.2 - Prob. 9GCh. 1.2 - Prob. 10GCh. 1.2 - Prob. 11GCh. 1.2 - Prob. 12GCh. 1.2 - Prob. 13GCh. 1.2 - Prob. 14GCh. 1.2 - Prob. 1ACh. 1.2 - Prob. 2ACh. 1.2 - Prob. 3ACh. 1.2 - Prob. 4ACh. 1.2 - Sometimes bar graphs will have more than one bar...Ch. 1.2 - Prob. 6ACh. 1.2 - Prob. 7ACh. 1.3 - Prob. 0LOCh. 1.3 - Prob. 1CCh. 1.3 - Prob. 2CCh. 1.3 - Prob. 3CCh. 1.3 - Prob. 4CCh. 1.3 - Prob. 5CCh. 1.3 - Prob. 6CCh. 1.3 - Prob. 7CCh. 1.3 - Prob. 8CCh. 1.3 - Prob. 1GCh. 1.3 - Prob. 2GCh. 1.3 - Prob. 3GCh. 1.3 - Prob. 4GCh. 1.3 - Prob. 5GCh. 1.3 - Prob. 6GCh. 1.3 - In a study of 400 entrees served at 75 campus...Ch. 1.3 - In a study of 400 entrees served at 75 campus...Ch. 1.3 - In a study of 400 entrees served at 75 campus...Ch. 1.3 - Prob. 1ACh. 1.3 - In a survey of 85 college students, 72 use...Ch. 1.3 - Two hundred patients suffering from depression...Ch. 1.3 - Prob. 4ACh. 1.3 - Prob. 5ACh. 1.3 - Prob. 6ACh. 1.3 - Prob. 7ACh. 1.3 - Two hundred patients suffering from depression...Ch. 1.3 - Prob. 1OCTACh. 1.3 - Prob. 3OCTACh. 1.4 - Prob. 1CCh. 1.4 - Prob. 2CCh. 1.4 - Prob. 3CCh. 1.4 - Prob. 4CCh. 1.4 - Prob. 5CCh. 1.4 - Prob. 6CCh. 1.4 - Prob. 7CCh. 1.4 - Prob. 8CCh. 1.4 - Prob. 9CCh. 1.4 - Prob. 10CCh. 1.4 - Prob. 11CCh. 1.4 - Prob. 12CCh. 1.4 - Prob. 13CCh. 1.4 - Prob. 14CCh. 1.4 - Prob. 15CCh. 1.4 - Prob. 16CCh. 1.4 - Prob. 17CCh. 1.4 - Prob. 18CCh. 1.4 - Prob. 19CCh. 1.4 - Complete the following table of common square...Ch. 1.4 - Prob. 1GCh. 1.4 - Prob. 2GCh. 1.4 - Prob. 3GCh. 1.4 - Prob. 4GCh. 1.4 - Prob. 5GCh. 1.4 - Prob. 6GCh. 1.4 - Prob. 7GCh. 1.4 - Prob. 8GCh. 1.4 - Prob. 9GCh. 1.4 - Prob. 10GCh. 1.4 - Prob. 11GCh. 1.4 - Spend some time thinking about each question...Ch. 1.4 - Prob. 1ACh. 1.4 - Prob. 2ACh. 1.4 - Prob. 3ACh. 1.4 - Prob. 4ACh. 1.4 - Prob. 5ACh. 1.4 - Prob. 6ACh. 1.5 - Prob. 0LOCh. 1.5 - For Questions 1-4, find the total amount of each...Ch. 1.5 - For Questions 1-4, find the total amount of each...Ch. 1.5 - For Questions 1-4, find the total amount of each...Ch. 1.5 - For Questions 1-4, find the total amount of each...Ch. 1.5 - Prob. 5GCh. 1.5 - Prob. 6GCh. 1.5 - Prob. 1CCh. 1.5 - Prob. 2CCh. 1.5 - Prob. 3CCh. 1.5 - Prob. 4CCh. 1.5 - Prob. 5CCh. 1.5 - Prob. 6CCh. 1.5 - Prob. 7CCh. 1.5 - Prob. 8CCh. 1.5 - Prob. 9CCh. 1.5 - Prob. 10CCh. 1.5 - Prob. 11CCh. 1.5 - Here are some addition problems for you to work...Ch. 1.5 - Prob. 13CCh. 1.5 - Prob. 14CCh. 1.5 - Here are some addition problems for you to work...Ch. 1.5 - Prob. 16CCh. 1.5 - Here are some addition problems for you to work...Ch. 1.5 - Here are some addition problems for you to work...Ch. 1.5 - Prob. 3GACh. 1.5 - Prob. 4GACh. 1.5 - Here are some addition problems for you to work...Ch. 1.5 - What would the ending balance have been if the...Ch. 1.5 - What would the ending balance be if we remove the...Ch. 1.5 - Prob. 8GACh. 1.5 - Prob. 9GACh. 1.5 - Prob. 10GACh. 1.5 - Prob. 11GACh. 1.5 - Prob. 12GACh. 1.5 - Prob. 13GACh. 1.5 - Prob. 14GACh. 1.5 - Prob. 15GACh. 1.5 - Prob. 16GACh. 1.5 - Prob. 1ACh. 1.5 - Prob. 2ACh. 1.5 - The perimeter of a figure is found by taking the...Ch. 1.5 - Prob. 4ACh. 1.5 - Prob. 5ACh. 1.5 - Prob. 6ACh. 1.5 - Prob. 7ACh. 1.5 - Prob. 8ACh. 1.5 - Prob. 9ACh. 1.6 - Prob. 1GCh. 1.6 - Prob. 2GCh. 1.6 - Prob. 3GCh. 1.6 - Prob. 4GCh. 1.6 - Prob. 5GCh. 1.6 - Prob. 6GCh. 1.6 - Prob. 7GCh. 1.6 - Prob. 8GCh. 1.6 - Prob. 9GCh. 1.6 - Prob. 10GCh. 1.6 - Prob. 11GCh. 1.6 - Prob. 13GCh. 1.6 - Prob. 14GCh. 1.6 - If you spend 30 minutes a day goofing off on the...Ch. 1.6 - Prob. 2ACh. 1.6 - Prob. 3ACh. 1.6 - Gaining or losing weight comes down to calories...Ch. 1.6 - Prob. 5ACh. 1.6 - Prob. 6ACh. 1.7 - Account 1: You deposit $1,000 into an account that...Ch. 1.7 - Account 1: You deposit $1,000 into an account that...Ch. 1.7 - Prob. 5GCh. 1.7 - Account 1: You deposit $1,000 into an account that...Ch. 1.7 - Account 1: You deposit $1,000 into an account that...Ch. 1.7 - Account 1: You deposit $1,000 into an account that...Ch. 1.7 - Prob. 2CCh. 1.7 - Prob. 3CCh. 1.7 - Prob. 4CCh. 1.7 - Prob. 5CCh. 1.7 - Prob. 6CCh. 1.7 - Prob. 7CCh. 1.7 - Prob. 9CCh. 1.7 - Prob. 10CCh. 1.7 - Prob. 12CCh. 1.7 - Prob. 13CCh. 1.7 - Prob. 1ACh. 1.7 - Prob. 2ACh. 1.7 - Prob. 3ACh. 1.7 - Prob. 4ACh. 1.7 - Prob. 5ACh. 1.7 - Prob. 6ACh. 1.8 - Prob. 0LOCh. 1.8 - Prob. 1GCh. 1.8 - Prob. 2GCh. 1.8 - Prob. 3GCh. 1.8 - Prob. 4GCh. 1.8 - Prob. 5GCh. 1.8 - Prob. 6GCh. 1.8 - Prob. 7GCh. 1.8 - Prob. 8GCh. 1.8 - Prob. 9GCh. 1.8 - Prob. 10GCh. 1.8 - Prob. 1CCh. 1.8 - Prob. 2CCh. 1.8 - Prob. 3CCh. 1.8 - In the first list, the values grow by ____________...Ch. 1.8 - Prob. 5CCh. 1.8 - Prob. 6CCh. 1.8 - Prob. 7CCh. 1.8 - Prob. 8CCh. 1.8 - Prob. 9CCh. 1.8 - Prob. 10CCh. 1.8 - Prob. 11CCh. 1.8 - Prob. 1ACh. 1.8 - Prob. 2ACh. 1.8 - Prob. 3ACh. 1.8 - Prob. 4ACh. 1.8 - Prob. 5ACh. 1.9 - After reading the opening paragraph, what do you...Ch. 1.9 - In his 2010 book The Global Achievement Gap,...Ch. 1.9 - In his 2010 book The Global Achievement Gap,...Ch. 1.9 - Prob. 3CCh. 1.9 - Prob. 4CCh. 1.9 - Prob. 5CCh. 1.9 - Prob. 6CCh. 1.9 - Prob. 7CCh. 1.9 - Heres a key quote from Wagners book: Today...Ch. 1.9 - Prob. 1GCh. 1.9 - Prob. 2GCh. 1.9 - Prob. 3GCh. 1.9 - Prob. 4GCh. 1.9 - Prob. 5GCh. 1.9 - Prob. 6GCh. 1.9 - Prob. 7GCh. 1.9 - Prob. 8GCh. 1.9 - Prob. 9GCh. 1.9 - Prob. 10GCh. 1.9 - Prob. 11GCh. 1.9 - Prob. 12GCh. 1.9 - Prob. 13GCh. 1.9 - Prob. 14GCh. 1.9 - Prob. 15GCh. 1.9 - Prob. 16GCh. 1.9 - Prob. 17GCh. 1.9 - Prob. 18GCh. 1.9 - Prob. 19GCh. 1.9 - Prob. 20GCh. 1.9 - Tennis balls are packaged in a cylindrical can,...Ch. 1.9 - Prob. 2ACh. 1.9 - Use the unit converter website you found in the...Ch. 1.9 - What percentage of the volume of the can is filled...Ch. 1.9 - After performing the division in Question 4, what...Ch. 1.9 - Racquetballs have a radius of about 2.8 cm. If...Ch. 1.10 - The spreadsheet summarizes the results for one...Ch. 1.10 - The spreadsheet summarizes the results for one...Ch. 1.10 - The spreadsheet summarizes the results for one...Ch. 1.10 - The spreadsheet summarizes the results for one...Ch. 1.10 - The spreadsheet summarizes the results for one...Ch. 1.10 - The spreadsheet summarizes the results for one...Ch. 1.10 - The spreadsheet summarizes the results for one...Ch. 1.10 - In math and stats, the term average is sort of a...Ch. 1.10 - The median of a list of numbers is the value that...Ch. 1.10 - The mode of a list of numbers is the value that...Ch. 1.10 - At the beginning of the course, you should have...Ch. 1.10 - Lets look at a fairly basic points system for...Ch. 1.10 - Lets look at a fairly basic points system for...Ch. 1.10 - If you dont show up for the first exam and take a...Ch. 1.10 - What would your final percentage be if you score...Ch. 1.10 - What does the difference between your answers to...Ch. 1.10 - Heres another look at a group of exam scores: Find...Ch. 1.10 - Heres another look at a group of exam scores: Find...Ch. 1.10 - Heres another look at a group of exam scores: Find...Ch. 1.10 - Find the mean, median, and mode for the scores on...
Knowledge Booster


Learn more about
Need a deep-dive on the concept behind this application? Look no further. Learn more about this topic, subject and related others by exploring similar questions and additional content below.Similar questions
- Obtain the voltage across the capacitor for the following input: (a) 5Volts; (b) 3sin(t); (c) 2 cos(t). please show that you use Partial Fraction Decomposition, Laplace transform and Cramer's rule.arrow_forwardObtain the voltage across the capacitor for the following input: (a) 5Volts; (b) 3sin(t); (c) 2 cos(t). please show that you use Laplace transform and Cramer's rule.arrow_forwardCalculate the sample mean and sample variance for the following frequency distribution of heart rates for a sample of American adults. If necessary, round to one more decimal place than the largest number of decimal places given in the data. Heart Rates in Beats per Minute Class Frequency 51-58 5 59-66 8 67-74 9 75-82 7 83-90 8arrow_forward
- can someone solvearrow_forwardProblem 3 Ten measurements of an impurity concentration in a process stream have been recorded. The sample mean is 87ppm and the sample standard deviation is ±13 ppm. Consider the null hypothesis that the impurity concentration has a true mean μo. Part A: Desired Probability that the sample mean will satisfy the null hypothesis: P = 0.4 Part B: Using the chart below, determine the4 highest value of the true mean that will lead to the null hypothesis being accepted with the probability assigned in Part A 1.00 0.90 0.80 0.70 0.60 0.50 0.40 Probability of accepting Ho 0.30 0.20 0.10 1 ° 0 30 40 50 75 100 10 0.2 0.4 0.6 0.8 1.0 1.2 =2.5 1.4 1.6 1.8 2.0 2.2 2.4 2.6 d 2.8 3.0 3.2arrow_forwardProblem 2 A chemical reactor system has been designed to perform optimally when operated at 150°C. The hypothesis test that will be used for evaluating the operating temperature will rely on 10 successive temperature measurements and will assign a 95% confidence interval for the result. The reactor system is judged to have a standard deviation of ±3°C. Part A: Actual operating temperature of the process T[°C] = 152.90 Part B: What is the probability that the hypothesis test for operating at 150°C described above will give a false acceptance (i.e., a type II error)?arrow_forward
- Problem 1 An airport is served with an average of 10 departures per day to your desired destination. However, all these flights leave at random times. You are trying to decide how long you are willing to wait to catch the next flight after you arrive at airport. Part A: Acceptable waiting time: T [min] = 78min Part B: What is the probability there will be exactly one departure during this waiting time? Part C: What is the probability there will be exactly no departure during this waiting time? Part D: Which calculation (B or C) should you use to make your decision to wait or leave? Why?arrow_forwardProblem 5 Consider the hospital admissions table presented in the lecture: 刊 Outcome LWBS Admitted Hospital 1 195 Hospital 2 270 Hospital 3 246 Hospital 4 242 1277 1558 1350 984 Not Admitted 3820 5163 4728 3103 Part A: What is the conditional probability that you were admitted if you went to hospital 3? Part B: What is the conditional probability that you went to hospital 3 if you were admitted?arrow_forwardQUAT6221wA1 Accessibility Mode Immersiv Q.1.2 Match the definition in column X with the correct term in column Y. Two marks will be awarded for each correct answer. (20) COLUMN X Q.1.2.1 COLUMN Y Condenses sample data into a few summary A. Statistics measures Q.1.2.2 The collection of all possible observations that exist for the random variable under study. B. Descriptive statistics Q.1.2.3 Describes a characteristic of a sample. C. Ordinal-scaled data Q.1.2.4 The actual values or outcomes are recorded on a random variable. D. Inferential statistics 0.1.2.5 Categorical data, where the categories have an implied ranking. E. Data Q.1.2.6 A set of mathematically based tools & techniques that transform raw data into F. Statistical modelling information to support effective decision- making. 45 Q Search 28 # 00 8 LO 1 f F10 Prise 11+arrow_forward
- Students - Term 1 - Def X W QUAT6221wA1.docx X C Chat - Learn with Chegg | Cheg X | + w:/r/sites/TertiaryStudents/_layouts/15/Doc.aspx?sourcedoc=%7B2759DFAB-EA5E-4526-9991-9087A973B894% QUAT6221wA1 Accessibility Mode பg Immer The following table indicates the unit prices (in Rands) and quantities of three consumer products to be held in a supermarket warehouse in Lenasia over the time period from April to July 2025. APRIL 2025 JULY 2025 PRODUCT Unit Price (po) Quantity (q0)) Unit Price (p₁) Quantity (q1) Mineral Water R23.70 403 R25.70 423 H&S Shampoo R77.00 922 R79.40 899 Toilet Paper R106.50 725 R104.70 730 The Independent Institute of Education (Pty) Ltd 2025 Q Search L W f Page 7 of 9arrow_forwardi need help pleasearrow_forwardCOM WIth Chegg Cheg x + w:/r/sites/TertiaryStudents/_layouts/15/Doc.aspx?sourcedoc=%7B2759DFAB-EA5E-4526-9991-9087A973B894%. QUAT6221wA1 Accessibility Mode Immersi The following table indicates the unit prices (in Rands) and quantities of three meals sold every year by a small restaurant over the years 2023 and 2025. 2023 2025 MEAL Unit Price (po) Quantity (q0)) Unit Price (P₁) Quantity (q₁) Lasagne R125 1055 R145 1125 Pizza R110 2115 R130 2195 Pasta R95 1950 R120 2250 Q.2.1 Using 2023 as the base year, compute the individual price relatives in 2025 for (10) lasagne and pasta. Interpret each of your answers. 0.2.2 Using 2023 as the base year, compute the Laspeyres price index for all of the meals (8) for 2025. Interpret your answer. Q.2.3 Using 2023 as the base year, compute the Paasche price index for all of the meals (7) for 2025. Interpret your answer. Q Search L O W Larrow_forward
arrow_back_ios
SEE MORE QUESTIONS
arrow_forward_ios
Recommended textbooks for you
 Elementary Geometry For College Students, 7eGeometryISBN:9781337614085Author:Alexander, Daniel C.; Koeberlein, Geralyn M.Publisher:Cengage,
 Holt Mcdougal Larson Pre-algebra: Student Edition...AlgebraISBN:9780547587776Author:HOLT MCDOUGALPublisher:HOLT MCDOUGAL
 Glencoe Algebra 1, Student Edition, 9780079039897...AlgebraISBN:9780079039897Author:CarterPublisher:McGraw Hill
 Trigonometry (MindTap Course List)TrigonometryISBN:9781337278461Author:Ron LarsonPublisher:Cengage Learning
 Algebra: Structure And Method, Book 1AlgebraISBN:9780395977224Author:Richard G. Brown, Mary P. Dolciani, Robert H. Sorgenfrey, William L. ColePublisher:McDougal Littell
 College Algebra (MindTap Course List)AlgebraISBN:9781305652231Author:R. David Gustafson, Jeff HughesPublisher:Cengage Learning
Elementary Geometry For College Students, 7e
Geometry
ISBN:9781337614085
Author:Alexander, Daniel C.; Koeberlein, Geralyn M.
Publisher:Cengage,
Holt Mcdougal Larson Pre-algebra: Student Edition...
Algebra
ISBN:9780547587776
Author:HOLT MCDOUGAL
Publisher:HOLT MCDOUGAL
Glencoe Algebra 1, Student Edition, 9780079039897...
Algebra
ISBN:9780079039897
Author:Carter
Publisher:McGraw Hill
Trigonometry (MindTap Course List)
Trigonometry
ISBN:9781337278461
Author:Ron Larson
Publisher:Cengage Learning
Algebra: Structure And Method, Book 1
Algebra
ISBN:9780395977224
Author:Richard G. Brown, Mary P. Dolciani, Robert H. Sorgenfrey, William L. Cole
Publisher:McDougal Littell
College Algebra (MindTap Course List)
Algebra
ISBN:9781305652231
Author:R. David Gustafson, Jeff Hughes
Publisher:Cengage Learning
Algebra - Pythagorean Theorem; Author: yaymath;https://www.youtube.com/watch?v=D_y_owf1WsI;License: Standard YouTube License, CC-BY
The Organic Chemistry Tutor; Author: Pythagorean Theorem Explained!;https://www.youtube.com/watch?v=B0G35RkmwSw;License: Standard Youtube License