
Concept explainers
a.
Identify the company which appears to be the largest at the end of Year 3, based on revenue.
a.
Answer to Problem 4MAD
The company which appears to be the largest using the revenue at the end of Year 3 is Company AT.
Explanation of Solution
Statement of
Statement of cash flow is a financial statement that shows the cash and cash equivalents of a company for a particular period of time. It shows the net changes in cash, by reporting the sources and uses of cash as a result of operating, investing, and financing activities of a company.
Company AT has more revenue of $163,786 which is more than the revenue of Company F of revenue $27,638. Hence, Company AT appears to be the largest revenue earning company at the end of Year 3.
b.
Identify the company which appears to be growing faster across the three years.
b.
Answer to Problem 4MAD
Company which appears to be growing faster across the three years is Company F.
Explanation of Solution
Identify the company which appears to be growing faster across the three years.
| Company | Year 3 | Year 2 | Year 1 |
| AT | 124% (1) | 111% (2) | 100% |
| F | 222% (3) | 144% (4) | 100% |
Table (1)
Working note (1):
Calculate the growth rate of Company AT for Year 3.
Working note (2):
Calculate the growth rate of Company AT for Year 2.
Working note (3):
Calculate the growth rate of Company F for Year 3.
Working note (4):
Calculate the growth rate of Company F for Year 2.
Hence, the company which appears to be growing faster across the three years is Company F.
c.
Compute the cash used to purchase property, plant, and equipment as a percent of the cash flows from operating activities for all three years for each company.
c.
Explanation of Solution
Compute the cash used to purchase property, plant, and equipment as a percent of the cash flows from operating activities for all three years for each company.
| Company AT | Year 3 | Year 2 | Year 1 |
| Cash flows from operating activities (A) | $39,344 | $35,880 | $31,338 |
| Cash used to purchase property, plant, and equipment (B) | $22,408 | $20,015 | $21,433 |
| Cash used to purchase property, plant, and equipment as a percentage of the cash flows from operating activities | 57% | 56% | 68% |
| Company F | Year 3 | Year 2 | Year 1 |
| Cash flows from operating activities (A) | $16,108 | $10,320 | $7,326 |
| Cash used to purchase property, plant, and equipment (B) | $4,491 | $2,523 | $1,831 |
| Cash used to purchase property, plant, and equipment as a percentage of the cash flows from operating activities | 28% | 24% | 25% |
Table (2)
d.
Identify the company which appears to require more cash to purchase property, plant, and equipment and explain its impact on
d.
Answer to Problem 4MAD
By using the computation in (C), it is clear that the company which appears to require more cash to purchase property, plant, and equipment is Company AT, and its impact on free cash flow is more negative.
Explanation of Solution
The cash used to purchase property, plant, and equipment as a percent of the cash flows from operating activities of Company F for Year 1 is 25% which is much less than that of Company AT of 68%. Both the company’s requirement of cash is increasing year by year, but Company AT’s requirement is higher than Company F’s requirement.
Hence, as the cash used to purchase property, plant, and equipment as a percent of the cash flows from operating activities of Company AT from Year 1 to Year 3 is increasing, the company which appears to require more cash to purchase property, plant, and equipment is Company AT, and its net impact on free cash flow is more negative.
e.
Compute the ratio of free cash flow to revenue for all three years for each company, and plot the data on a line chart.
e.
Explanation of Solution
Compute the free cash flow of Company AT.
| Year 3 | Year 2 | Year 1 | |
| Cash flows from operating activities | $39,344 | $35,880 | $31,338 |
| Less: Cash used to purchase property, plant, and equipment |
($22,408) |
($20,015) |
($21,433) |
| Free cash flow | $16,936 | $15,865 | $9,905 |
Table (3)
Compute the ratio of free cash flow to revenue for Company AT.
| Year 3 | Year 2 | Year 1 | |
| Free cash flow (A) | $16,936 | $15,865 | $9,905 |
| Revenue (B) | $163,786 | $146,801 | $132,447 |
|
Ratio of free cash flow to revenue | 10.3% | 10.8% | 7.5% |
Table (4)
Compute the free cash flow of Company F.
| Year 3 | Year 2 | Year 1 | |
| Cash flows from operating activities | $16,108 | $10,320 | $7,326 |
| Less: Cash used to purchase property, plant, and equipment | $4,491 | $2,523 | $1,831 |
| Free cash flow | $11,617 | $7,797 | $5,495 |
Table (5)
Compute the ratio of free cash flow to revenue for Company F.
| Year 3 | Year 2 | Year 1 | |
| Free cash flow (A) | $11,617 | $7,797 | $5,495 |
| Revenue (B) | $27,638 | $17,928 | $12,466 |
|
Ratio of free cash flow to revenue | 42.0% | 43.5% | 44.1% |
Table (6)
Plot the free cash flow to revenue of both the companies on a line chart.
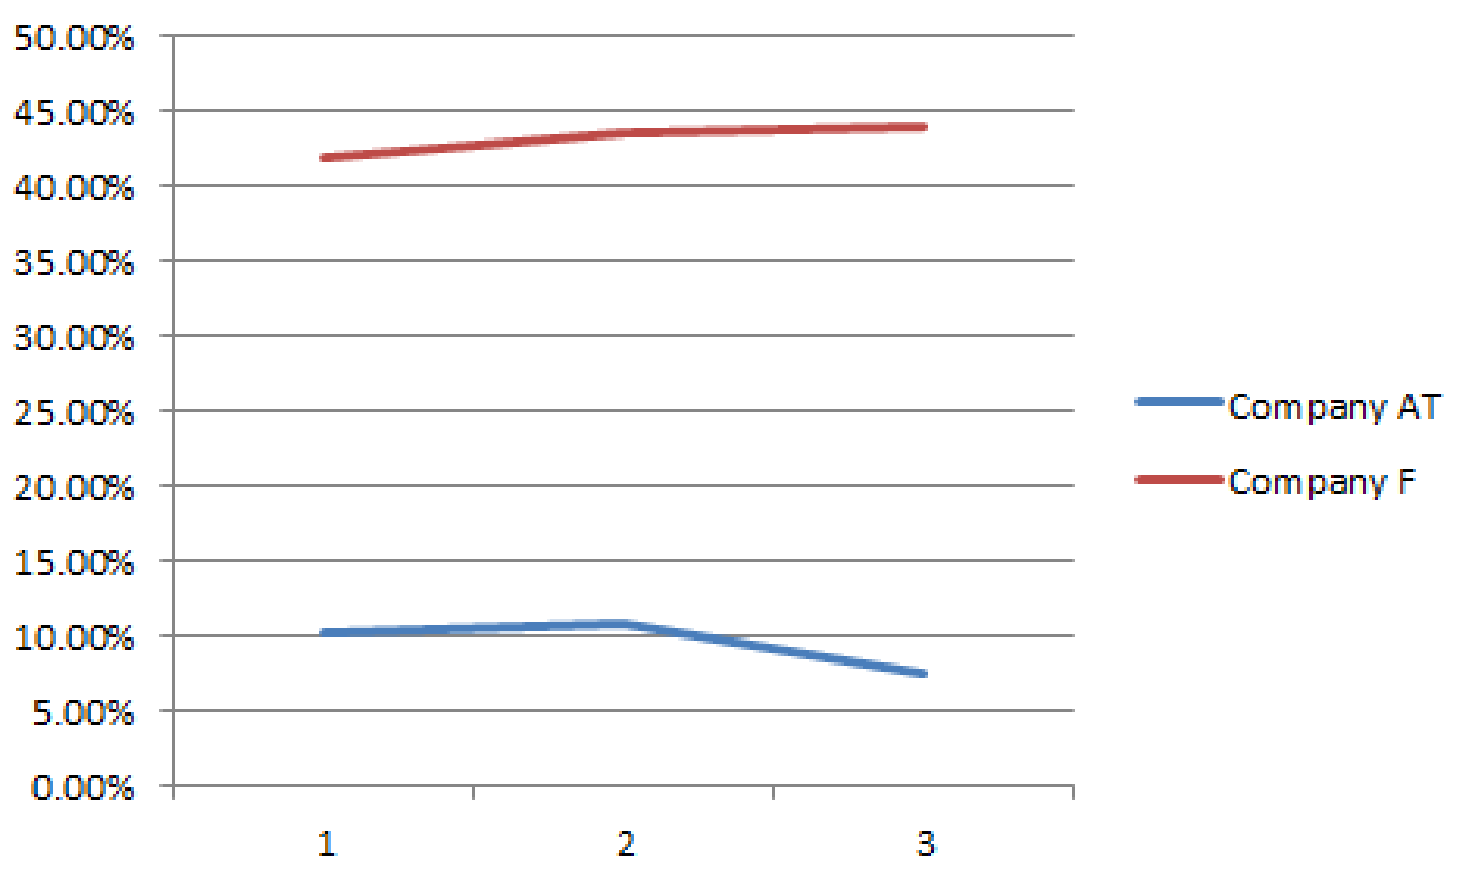
Hence, the ratio of free cash flow to revenue for Year 3, Year 2, and Year 1 for Company AT are 10.3%, 10.8%, and 7.5% respectively, and for Company F is 42.0%, 43.5%, and 44.1% respectively.
f.
Interpret the chart.
f.
Explanation of Solution
The ratio of free cash flow to revenue of Company F for Year 1 was better when compared to Company AT, as Company F’s ratio is almost 6 times higher than Company AT’s ratio. But in the Year 2, and Year 3, the ratios of free cash flow to revenue of Company F were not much greater than Company AT.
Individually, both companies ratio is remained stable over the years, as both the cash flow from operating activities and cash used to purchase property, plant, and equipment were increasing steadily. However, Company F’s requirement to purchase property, plant, and equipment has increased more than the increase in cash flow from operating activities.
This has caused the decline in the ratio of free cash flow to revenue for Company F in year 2 and year 3.
Want to see more full solutions like this?
Chapter 15 Solutions
Managerial Accounting


- Can you explain this general accounting question using accurate calculation methods?arrow_forwardCan you solve this general accounting problem using accurate calculation methods?arrow_forwardTidal Industries had a beginning finished goods inventory of$27,800 and an ending finished goods inventory of $25,200 during FY 2024. Beginning work-in-process was $22,300 and ending work-in-process was $20,500.Factory overhead was $32,400. The total manufacturing costs amounted to $315,600. Use this information to determine the FY 2024 Cost of Goods Sold.arrow_forward
- Please provide the correct answer to this general accounting problem using accurate calculations.arrow_forwardPlease provide the accurate answer to this general accounting problem using valid techniques.arrow_forwardCan you help me solve this general accounting problem using the correct accounting process?arrow_forward
 Business/Professional Ethics Directors/Executives...AccountingISBN:9781337485913Author:BROOKSPublisher:Cengage
 Accounting Information SystemsAccountingISBN:9781337619202Author:Hall, James A.Publisher:Cengage Learning,
 Managerial Accounting: The Cornerstone of Busines...AccountingISBN:9781337115773Author:Maryanne M. Mowen, Don R. Hansen, Dan L. HeitgerPublisher:Cengage Learning
 Pkg Acc Infor Systems MS VISIO CDFinanceISBN:9781133935940Author:Ulric J. GelinasPublisher:CENGAGE L
 Financial AccountingAccountingISBN:9781337272124Author:Carl Warren, James M. Reeve, Jonathan DuchacPublisher:Cengage Learning