Subpart (a):
Long run equilibrium in AD-AS model.
Subpart (a):
Explanation of Solution
The supply depends upon the
The demand comes from all the economic agents such as the households, firms as well as the government. The demand depends on the price level of the economy. The increase and decrease in the price level determines the level of demand in the economy. The aggregation of all the individual demands in the economy is known as the aggregate demand thus, the aggregate demand explains the relationship between the general price level and the level of real
The equilibrium is a condition where the aggregate demand curve of the economy intersects with the aggregate supply curve of the economy. Then there will be an equilibrium point derived where the economy will be in its equilibrium without any excess demand or supply. The quantity on the X axis will represent the
Concept introduction:
Aggregate demand curve: It is the curve which shows the relationship between the price level in the economy and the quantity of real GDP demanded by the economic agents such as the households, firms as well as the government.
Equilibrium: The equilibrium in the economy is the point where the economy's aggregate demand curve and the aggregate supply curve intersects with each other. There will be no excess demand or
Subpart (b):
Long run equilibrium in AD-AS model.
Subpart (b):
Explanation of Solution
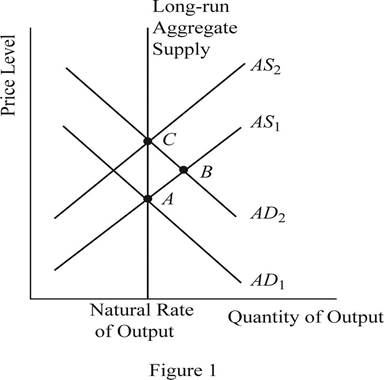
When the money supply of the economy increases with the intervention of the Central Bank of the economy, the money with the public will increase. When the money with the public increases, they will feel wealthier and as a result they will demand more consumer goods and services. As a result, the aggregate demand of the economy increases and it will shift the AD curve towards the right. This can be identified as the change to the equilibrium point B as shown in Figure 1. Thus, in short, the increase in the money supply leads to the increase in the output and price level of the economy.
Concept introduction:
Aggregate demand curve: It is the curve which shows the relationship between the price level in the economy and the quantity of real GDP demanded by the economic agents such as the households, firms as well as the government.
Aggregate supply curve: In the short run, it is a curve which shows the relationship between the price level in the economy and the supply in the economy by the firms. In the long run, it shows the relationship between the price level and the level of quantity supplied by the firms.
Equilibrium: The equilibrium in the economy is the point where the economy's aggregate demand curve and the aggregate supply curve intersects with each other. There will be no excess demand or excess supply in the economy at the equilibrium.
Subpart (c):
Long run equilibrium in AD-AS model.
Subpart (c):
Explanation of Solution
When the AD curve shifts towards the right and increases the output and the price level in the short run, over time, the nominal wages, prices as well as the perceptions and expectations of the economy would adjust to the new equilibrium level. As a result of this gradual adjustment, the cost of production will increase and the result will be a leftward shift in the aggregate supply curve of the economy. Then the economy will return to its natural level of output at a higher price level of the economy. This can be identified as the movement from point B to point C in the graph shown above.
Concept introduction:
Aggregate demand curve: It is the curve which shows the relationship between the price level in the economy and the quantity of real GDP demanded by the economic agents such as the households, firms as well as the government.
Aggregate supply curve: In the short run, it is a curve which shows the relationship between the price level in the economy and the supply in the economy by the firms. In the long run, it shows the relationship between the price level and the level of quantity supplied by the firms.
Equilibrium: The equilibrium in the economy is the point where the economy's aggregate demand curve and the aggregate supply curve intersects with each other. There will be no excess demand or excess supply in the economy at the equilibrium.
Subpart (d):
Long run equilibrium in AD-AS model.
Subpart (d):
Explanation of Solution
The sticky wages theory suggests that when there is inflation in the economy, the wage rate will adjust very slowly to the inflation. More or less the wage rates will be sticky and the main reason will be the long term contracts between the employer and the employees. Thus, in the short run equilibriums such as point A and point B, the wages of the economy would be more or less equal to each other. Whereas the point C represents the long run equilibrium and thus, the wages at the point C will be higher than that in point A and B.
Concept introduction:
Aggregate demand curve: It is the curve which shows the relationship between the price level in the economy and the quantity of real GDP demanded by the economic agents such as the households, firms as well as the government.
Aggregate supply curve: In the short run, it is a curve which shows the relationship between the price level in the economy and the supply in the economy by the firms. In the long run, it shows the relationship between the price level and the level of quantity supplied by the firms.
Equilibrium: The equilibrium in the economy is the point where the economy's aggregate demand curve and the aggregate supply curve intersects with each other. There will be no excess demand or excess supply in the economy at the equilibrium.
Subpart (e):
Long run equilibrium in AD-AS model.
Subpart (e):
Explanation of Solution
The sticky wages theory suggests that when there is inflation in the economy, the wage rate will adjust very slowly to the inflation. More or less, the wage rates will be sticky and the main reason will be the long term contracts between the employer and the employees. So, the nominal wages at equilibrium point A and B will be same. But the increase in the general price level in the economy would reduce the real wages of the workers because, the real wage is the nominal wage divided by the price level. When the denominator increases, it will reduce the value of the real wages in the economy.
Concept introduction:
Aggregate demand curve: It is the curve which shows the relationship between the price level in the economy and the quantity of real GDP demanded by the economic agents such as the households, firms as well as the government.
Aggregate supply curve: In the short run, it is a curve which shows the relationship between the price level in the economy and the supply in the economy by the firms. In the long run, it shows the relationship between the price level and the level of quantity supplied by the firms.
Equilibrium: The equilibrium in the economy is the point where the economy's aggregate demand curve and the aggregate supply curve intersects with each other. There will be no excess demand or excess supply in the economy at the equilibrium.
Sub part (f):
Long run equilibrium in AD-AS model.
Sub part (f):
Explanation of Solution
When the increase in the money supply happens in the economy, it will lead to the increase in the nominal wages as well as the price level in the economy in the long run. As a result of the increase in the nominal wage rate along with the price level in the economy, the real wage rate of the economy would remain unchanged. Thus, the neutrality of money applies in the long run equilibrium.
Concept introduction:
Aggregate demand curve: It is the curve which shows the relationship between the price level in the economy and the quantity of real GDP demanded by the economic agents such as the households, firms as well as the government.
Aggregate supply curve: In the short run, it is a curve which shows the relationship between the price level in the economy and the supply in the economy by the firms. In the long run, it shows the relationship between the price level and the level of quantity supplied by the firms.
Equilibrium: The equilibrium in the economy is the point where the economy's aggregate demand curve and the aggregate supply curve intersects with each other. There will be no excess demand or excess supply in the economy at the equilibrium.
Want to see more full solutions like this?
Chapter 15 Solutions
Brief Principles of Macroeconomics (MindTap Course List)

- Using the graph on the right, determine the per unit prices of capital and labour. 20- Given the information provided about the isocost lines, we know that the per unit price of capital is TC=$100 and the per unit price of labour is 16- TC $80 ○ A. $50; $20 ○ B. $2; $5 ○ C. $5; $2 ○ D. $20; $50 E. not determinable; not determinable Quantity of K 12 TC $60 TC $40 0 10 20 30 Quantity of L 40arrow_forwardThe diagram to the right contains isocost lines A and B. If the price of capital is the same for both lines, then the difference between isocost line A and isocost line B is that OA. the total cost is larger along B. B. the level of output is lower along A. C. both capital and labour are cheaper along A. OD. labour is more expensive along A. ○ E. labour is more expensive along B. Capital Labourarrow_forwardFor the firm whose cost curves are shown at right, the minimum efficient scale is ○ A. between 60 and 140 units of production. OB. about 20 units of production. OC. about 60 units of production. OD. about 100 units of production. OE. the level of fixed cost corresponding to SRATC2. SRATC₁ LRAC SRATC4 SRATC₂ SRATC3 เนด เad iso C 20 20 40 60 80 100 120 140 160 180 200 Output per Periodarrow_forward
- SRATC₂ SRATC3 In the figure, increasing long-run average total costs for the firm are confined to the output range OA. where the LRAC curve is downward sloping. B. above 80 units of output. O C. above 50 units of output. OD. between 50 and 80 units of output. SRATC₁ OE. between 10 and 100 units of output. ---- SRATC LRAC 10 20 30 40 50 60 70 80 90 100 Output per Periodarrow_forwardFor the firm whose cost curves are shown at right, the minimum efficient scale is OA. between 10 and 50 units of production. OB. about 80 units of production. O C. the level of fixed cost corresponding to SRATC₁. OD. about 10 units of production. ○ E. about 50 units of production. Cost per Unit SRATC₁ LRAC SRATC2 SRATC4 SRATC3 10 20 30 40 50 60 70 80 Output per Period 90 100arrow_forward• 3 different people working at any companies under the BPO industry in the Philippines. • What are the 3 different Vision, Mission, Duties and Responsibilities and Career Path of these people in their companies under the BPO industry?arrow_forward
- Module 6 ⚫(1902) Buckner C X | (1902) How to d x (1902) Buckner F X (1902) Productic X WP Videoplayer Canvas Login | Ir x | + Σ R mybrcc.instructure.com/courses/417310/discussion_topics/3420114?module_item_id=20155705 Spring 2025 Home Announcements Modules Syllabus Grades 8 People BRCC-_Library DLASC Module 6 Discussion - Business Costs Relaunch to update For this discussion, think about where you work or a business you have a significant amount of knowledge about. What is a common product that the business sells? What are the main costs the business has to incur in order to be able to sell that product? Which of these costs are fixed and which are variable? How much additional costs would be incurred if it were to sell one additional unit of that product (marginal cost)? Write a discussion thread about this business, the product it commonly sells, and your answers to the above questions. Also, respond to at least two threads created by your classmates. In these responses, share what…arrow_forwardRefer to the video to answer the following: • what are all the key policies or all the strategies the Philippine government should prioritize to accelerate sustainable economic growth? • these should consider the Philippines current economic challenges, including inflation, unemployment, and the need for digital transformation. "The Philippines' Strong Economic Growth" (YouTube link: https://youtu.be/1YtEoGp2ZeM?siJQfIv5kbu0txVsLL.)arrow_forwardsolve about this qarrow_forward
 Essentials of Economics (MindTap Course List)EconomicsISBN:9781337091992Author:N. Gregory MankiwPublisher:Cengage Learning
 Principles of Economics (MindTap Course List)EconomicsISBN:9781305585126Author:N. Gregory MankiwPublisher:Cengage Learning
 Principles of Macroeconomics (MindTap Course List)EconomicsISBN:9781285165912Author:N. Gregory MankiwPublisher:Cengage Learning
 Brief Principles of Macroeconomics (MindTap Cours...EconomicsISBN:9781337091985Author:N. Gregory MankiwPublisher:Cengage Learning
 Principles of Economics, 7th Edition (MindTap Cou...EconomicsISBN:9781285165875Author:N. Gregory MankiwPublisher:Cengage Learning
 Principles of Macroeconomics (MindTap Course List)EconomicsISBN:9781305971509Author:N. Gregory MankiwPublisher:Cengage Learning