
Concept explainers
Videos
Use the graph to write a verbal description of trends in the unemployment rate, then explain why the graph makes it easier than the table did.
Without the numbers running along the bottom side of the graph and down the left side, we wouldn’t be able to understand any of the information the graph provides. Those numbers provide the scale for the graph, and they’re ALWAYS crucial in drawing a graph. Each of the number lines that we write the scale on is called an axis (the plural of this word is axes).
Based on figures from January to October of 2016, the average unemployment rate for that year was expected to be about 4.9%. We can add that piece of information to the graph by finding 2016 on the horizontal axis and 4.9 on the vertical axis, then drawing imaginary lines up from 2016 and right from 4.9 until the lines meet: That’s where we put the point corresponding to 2016 and 4.9%.
Unemployment Rate in the United States
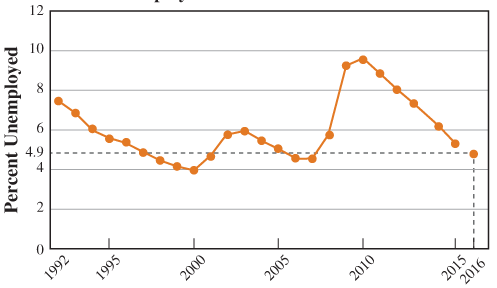
Year
Notice that when we found the location to indicate that the unemployment rate was 4.9% in 2016, the imaginary lines we drew formed a rectangle with the two axes. That’s why we call this system of graphing a rectangular
Since we didn’t need to worry about negative years or negative unemployment rates, the graph we drew earlier only showed positive values along each axis. But there are plenty of examples of data where negative values make perfect sense, so a rectangular coordinate system is often set up like this:
The process of locating information on a rectangular coordinate system, like the 4.9% unemployment rate in 2016, is called plotting points. We identify locations by writing the two coordinates together inside parentheses, like this: (2016, 4.9).

Trending nowThis is a popular solution!

Chapter 1 Solutions
PATHWAYS TO MATH LITERACY- ACCESS CARD
Additional Math Textbook Solutions
Pathways To Math Literacy (looseleaf)
Elementary and Intermediate Algebra: Concepts and Applications (7th Edition)
Graphical Approach To College Algebra
Probability And Statistical Inference (10th Edition)
Precalculus
APPLIED STAT.IN BUS.+ECONOMICS


- = Consider the hypothesis test Ho: μ₁ = μ₂ against H₁ μ₁ μ2. Suppose that sample sizes are n₁ = 15 and n₂ = 15, that x1 = 4.7 and X2 = 7.8 and that s² = 4 and s² = 6.26. Assume that o and that the data are drawn from normal distributions. Use απ 0.05. (a) Test the hypothesis and find the P-value. (b) What is the power of the test in part (a) for a true difference in means of 3? (c) Assuming equal sample sizes, what sample size should be used to obtain ẞ = 0.05 if the true difference in means is - 2? Assume that α = 0.05. (a) The null hypothesis is 98.7654). rejected. The P-value is 0.0008 (b) The power is 0.94 . Round your answer to four decimal places (e.g. Round your answer to two decimal places (e.g. 98.76). (c) n₁ = n2 = 1 . Round your answer to the nearest integer.arrow_forwardConsider the hypothesis test Ho: = 622 against H₁: 6 > 62. Suppose that the sample sizes are n₁ = 20 and n₂ = 8, and that = 4.5; s=2.3. Use a = 0.01. (a) Test the hypothesis. Round your answers to two decimal places (e.g. 98.76). The test statistic is fo = i The critical value is f = Conclusion: i the null hypothesis at a = 0.01. (b) Construct the confidence interval on 02/022 which can be used to test the hypothesis: (Round your answer to two decimal places (e.g. 98.76).) iarrow_forwardConjecture Let x and y be integers. If x is even and y is odd, then xy is even. Try some examples. Does the conjecture seem to be true or false?arrow_forward
- Find the general solution to the differential equationarrow_forward3. A room has a large circular table with ten seats, numbered 1 to 10, such that to the right of seat number i is seat number i + 1 for all i ∈ {1, . . . , 9} and to the right of seat 10 is seat 1. We want to assign seats to 10 people, 6 of them only speak Slovene, 1 of them only speaks English, and the remaining 3 speak both Slovene and English, by giving out numbered place cards. In how many ways can we do that so that everyone sits next to at least one person who speaks a common language?arrow_forwardcharity savings Budget for May travel food Peter earned $700 during May. The graph shows how the money was used. What fraction was clothes? O Search Submit clothes leisurearrow_forward
- Exercise 11.3 A slope field is given for the equation y' = 4y+4. (a) Sketch the particular solution that corresponds to y(0) = −2 (b) Find the constant solution (c) For what initial conditions y(0) is the solution increasing? (d) For what initial conditions y(0) is the solution decreasing? (e) Verify these results using only the differential equation y' = 4y+4.arrow_forwardSOLVE ONLY FOR (L) (M) AND (O)arrow_forwardAphids are discovered in a pear orchard. The Department of Agriculture has determined that the population of aphids t hours after the orchard has been sprayed is approximated by N(t)=1800−3tln(0.17t)+t where 0<t≤1000. Step 1 of 2: Find N(63). Round to the nearest whole number.arrow_forward
- 1. A telegraph can transmit two different signals: a dot and a dash. We want to encode the 26 letters of the English alphabet and the ten digits 0, 1, 2, . . . , 9 using sequences of these two symbols. What is the smallest integer n such that we can encode all these letters and digits with sequences of length at most n and length at least 1?arrow_forwardUse the graph of y = f(x) to answer the following. 3- 2 -4 -2 -1 1 2 3 4 -1 2 m -3- + (d) Find all x for which f(x) = -2. If there is more than one value, separate them with commas or write your answer in interval notation, if necessary. Select "None", if applicable. Value(s) of x for which f(x)=-2: | (0,0) (0,0) (0,0) (0,0) 0,0... -00 None (h) Determine the range of f. The range is (0,0) Garrow_forwardFile Preview A gardener has ten different potted plants, and they are spraying the plants with doses of Tertizers. Plants can receive zero or more doses in a session. In the following, we count each possible number of doses the ten plants can receive (the order of spraying in a session does not matter). (a) How many ways are there if there were twelve total doses of a single type of fertilizer? (b) How many ways are there if there are six total doses of a single type of fertilizer, each plant receives no more than one dose? (c) How many ways are there if is was one dose of each of six types of fertilizers? (d) How many ways are there if there are four doses of fertilizer #1 and eight doses of fertilizer #2? (e) How many ways are there if there are four doses of fertilizer #1 and eight doses of fertilizer #2, and each plant receives no more than one dose of fertilizer #1? (f) How many ways are there to do two sessions of spraying, where each plant receives at most two doses total?arrow_forward
 Glencoe Algebra 1, Student Edition, 9780079039897...AlgebraISBN:9780079039897Author:CarterPublisher:McGraw Hill
 Intermediate AlgebraAlgebraISBN:9781285195728Author:Jerome E. Kaufmann, Karen L. SchwittersPublisher:Cengage Learning
 Algebra: Structure And Method, Book 1AlgebraISBN:9780395977224Author:Richard G. Brown, Mary P. Dolciani, Robert H. Sorgenfrey, William L. ColePublisher:McDougal Littell
 Algebra for College StudentsAlgebraISBN:9781285195780Author:Jerome E. Kaufmann, Karen L. SchwittersPublisher:Cengage Learning
 Elementary AlgebraAlgebraISBN:9780998625713Author:Lynn Marecek, MaryAnne Anthony-SmithPublisher:OpenStax - Rice University
 Algebra & Trigonometry with Analytic GeometryAlgebraISBN:9781133382119Author:SwokowskiPublisher:Cengage