
Concept explainers
Videos
(a)
Find the value of point-biserial
(a)
Answer to Problem 28CAP
The value of point-biserial
Explanation of Solution
Calculation:
The given information is that, the researcher is interested to determine the relation between the factors political affiliation (X) and attitude toward gun control (Y).
Point-biserial correlation coefficient:
When the one factor is continuous that is measured on either interval scale or ratio scale and other is dichotomous that is measured on nominal scale, then the strength and direction of the linear relationship between the two factors can be measured by Point-biserial correlation coefficient. It is denoted by
In the formula, p and q are the proportion of scores for the dichotomous factor at each level,
The Point-biserial correlation for political affiliation and attitude toward gun control is to be calculated. The factor ‘political affiliation’ has to be coded with 1 and 2. Code the value 1 for ‘Democrat’ and 2 for ‘Republican’ for dichotomous factor ‘recycle’.
The coded data is,
| Recycle |
Attitude toward Eco friendly |
| 1 | 1 |
| 1 | 3 |
| 1 | 1 |
| 1 | 1 |
| 1 | 3 |
| 2 | 7 |
| 2 | 6 |
| 2 | 5 |
| 2 | 6 |
| 2 | 4 |
| 2 | 6 |
| 2 | 5 |
Software procedure:
Step by step procedure to obtain correlation value for factors political affiliation (X) and attitude toward gun control (Y) using SPSS software is given as,
- Choose Variable view.
- Under the name, enter the name as X, Y.
- Choose Data view, enter the data.
- Choose Analyze>Correlate>Bivariate.
- In variables, enter the X, andY.
- Click OK.
Output using SPSS software is given below:
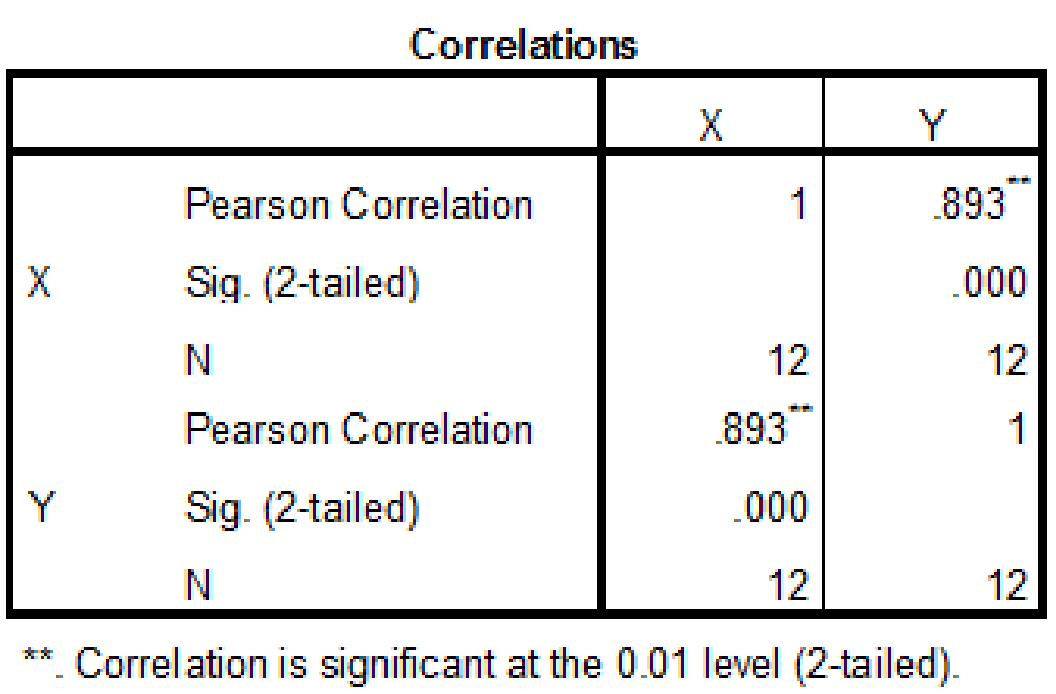
The correlation coefficient value is 0.893.
(b)
Determine the decision for the null hypothesis using two-tailed test at a 0.05 level of significance
(b)
Answer to Problem 28CAP
The decision is to reject the null hypothesis.
The point-biserial correlation coefficient between political affiliation and attitude toward gun control is significant.
Explanation of Solution
Calculation:
The given information is that, the correlation coefficient value is –0.893 and degrees of freedom is 10.
Test statistic:
The coefficient of determination for the point-serial correlation and the effect size of the two-independent-sample t test are similar and hence for significance test of point-biserial correlation, t test is used.
The formula for converting the r to a t statistic is,
In the formula, r denotes the correlation coefficient and df is the degrees of freedom for correlation coefficient.
Degrees of freedom:
The formula is.
In formula, n denotes the
Decision rules:
- If the test statistic value is greater than the critical value, then reject the null hypothesis and test is significant, or else retain the null hypothesis.
- If the negative test statistic value is less than negative critical value, then reject the null hypothesis and test is significant, or else retain the null hypothesis.
The correlation between political affiliation and attitude toward gun control is to be tested.Let
Null hypothesis:
That is, the point-biserialcorrelation coefficient between political affiliation and attitude toward gun control is not significant.
Alternative hypothesis:
That is, the point-biserial correlation coefficient between political affiliation and attitude toward gun control is significant.
Degrees of freedom:
A sample of 12 participants is taken. The degrees of freedom are,
Test statistic:
Substitute,
The value of t is,
Critical value:
The given significance level is
The test is two tailed, the degrees of freedom are 10, and the alpha level is 0.05.
From the Appendix B: Table B.2 the t Distribution:
- Locate the value 10 in the degrees of freedom (df) column.
- Locate the 0.05 in the proportion in two tails combined row.
- The intersecting value that corresponds to the 10 with level of significance 0.05 is 2.228.
Thus, the critical value for
Conclusion:
The value of test statistic is 6.283.
The critical value is 2.228.
The test statistic value is greater than the critical value.
The test statistic value falls under critical region.
Hence the null hypothesis is rejected and test is significant.
The point-biserial correlation coefficient between political affiliation and attitude toward gun control is significant.
Want to see more full solutions like this?
Chapter 15 Solutions
Statistics for the Behavioral Sciences


- According to flightstats.com, American Airlines flights from Dallas to Chicago are on time 80% of the time. Suppose 10 flights are randomly selected, and the number of on-time flights is recorded. (a) Explain why this is a binomial experiment. (b) Determine the values of n and p. (c) Find and interpret the probability that exactly 6 flights are on time. (d) Find and interpret the probability that fewer than 6 flights are on time. (e) Find and interpret the probability that at least 6 flights are on time. (f) Find and interpret the probability that between 4 and 6 flights, inclusive, are on time.arrow_forwardShow how you get critical values of 1.65, -1.65, and $1.96 for a right-tailed, left- tailed, and two-tailed hypothesis test (use a = 0.05 and assume a large sample size).arrow_forwardSuppose that a sports reporter claims the average football game lasts 3 hours, and you believe it's more than that. Your random sample of 35 games has an average time of 3.25 hours. Assume that the population standard deviation is 1 hour. Use a = 0.05. What do you conclude?arrow_forward
- Suppose that a pizza place claims its average pizza delivery time is 30 minutes, but you believe it takes longer than that. Your sample of 10 pizzas has an average delivery time of 40 minutes. Assume that the population standard deviation is 15 minutes and the times have a normal distribution. Use a = 0.05. a. What are your null and alternative hypotheses? b. What is the critical value? c. What is the test statistic? d. What is the conclusion?arrow_forwardTable 5: Measurement Data for Question 9 Part Number Op-1, M-1 Op-1, M-2 | Op-2, M-1 Op-2, M-2 | Op-3, M-1 Op-3, M-2 1 21 20 20 20 19 21 2 24 23 24 24 23 24 3 4 5 6 7 8 9 10 11 21 12 8222332 201 21 20 22 20 22 27 27 28 26 27 28 19 18 19 21 24 21 22 19 17 18 24 23 25 25 23 26 20 20 18 19 17 13 23 25 25 2 3 3 3 3 2 3 18 18 21 21 23 22 24 22 20 19 23 24 25 24 20 21 19 18 25 25 14 24 24 23 25 24 15 29 30 30 28 31 16 26 26 25 26 25 17 20 20 19 20 20 843882388 20 18 25 20 19 25 25 30 27 20 18 19 21 19 19 21 23 19 25 26 25 24 25 25 20 19 19 18 17 19 17 Question 9 A measurement systems experiment involving 20 parts, three operators (Op-1, Op-2, Op-3), and two measure- ments (M-1, M-2) per part is shown in Table 5. (a) Estimate the repeatability and reproducibility of the gauge. (b) What is the estimate of total gauge variability?" (c) If the product specifications are at LSL = 6 and USL 60, what can you say about gauge capability?arrow_forwardQuestion 5 A fraction nonconforming control chart with center line 0.10, UCL = 0.19, and LCL = 0.01 is used to control a process. (a) If three-sigma limits are used, find the sample size for the control charte 2 (b) Use the Poisson approximation to the binomial to find the probability of type I error. (c) Use the Poisson approximation to the binomial to find the probability of type II error if the process fraction defective is actually p = 0.20.arrow_forward
- Question 8 Ten parts are measured three times by the same operator in a gauge capability study. The data are shown in Table 4. (a) Describe the measurement error that results from the use of this gauge. I (b) Estimate total variability and product variability. (c) What percentage of total variability is due to the gauge? (d) If specifications on the part are at 100±15, find the P/T ratio for this gauge. Comment on the adequacy of the gauge. 3 Table 4: Measurement Data for Question 8 Part Number Measurement 1 Measurement 2 Measurement 3 1 2 100 95 101 100 93 97 3 101 103 100 4 96 95 97 5 98 98 96 6 99 98 98 7889 95 97 98 100 99 98 100 100 97 10 100 98 98 99arrow_forwardQuestion 6 The data shown in Table 3 are and R values for 24 samples of size n = 5 taken from a process producing bearings. The measurements are made on the inside diameter of the bearing, with only the last three decimals recorded (i.e., 34.5 should be 0.50345). Perform a process capability analysis using and R charts for the data from Table 3. Table 3: Data for Question 6 Sample Number R | Sample Number I Ꭱ 1 34.5 3 13 35.4 8 2 34.2 4 14 34.0 6 ∞∞ 31.6 15 37.1 5 4 31.5 4 16 34.9 7 56789 35.0 5 17 33.5 4 34.1 6 18 31.7 3 32.6 4 19 34.0 8 33.8 3 20 35.1 4 34.8 7 10 33.6 8 11 31.9 3 12 38.6 9 2232 21 33.7 2 32.8 1 33.5 24 34.2 2 32 3arrow_forwardQuestion 1 The commercial loan operation of a financial institution has a standard for processing new loan applications in 24 hours. Table 1 shows the number of applications processed each day for the last 20 days and the number of applications that required more than 24 hours to complete. Table 1: Loan Application Data for Question 1 Day Applications Late Day Applications Late 1 200 3 11 219 0 2 250 4 12 238 10 3 240 2 13 250 4 4 300 5 14 302 6 5 200 2 15 219 20 6 250 4 16 246 3 7 246 3 17 251 6 8 258 5 18 273 7 9 275 2 19 245 3 10 274 1 20 260 (a) Set up the fraction nonconforming control chart for this process. Use the variable-width control limit approach. Plot the preliminary data in Table 1 on the chart. Is the process in statistical control? (b) Assume that assignable causes can be found for any out-of-control points on this chart. What center line should be used for process monitoring in the next period, and how should the control limits be calculated?arrow_forward
- help me with ab please. please handwrite if possible. please don't use AI tools to answerarrow_forwardhelp me with ab please. please handwrite if possible. please don't use AI tools to answerarrow_forwardhelp me with abcd please. please handwrite if possible. please don't use AI tools to answerarrow_forward
 Glencoe Algebra 1, Student Edition, 9780079039897...AlgebraISBN:9780079039897Author:CarterPublisher:McGraw Hill
 Big Ideas Math A Bridge To Success Algebra 1: Stu...AlgebraISBN:9781680331141Author:HOUGHTON MIFFLIN HARCOURTPublisher:Houghton Mifflin Harcourt
 College Algebra (MindTap Course List)AlgebraISBN:9781305652231Author:R. David Gustafson, Jeff HughesPublisher:Cengage Learning
 Holt Mcdougal Larson Pre-algebra: Student Edition...AlgebraISBN:9780547587776Author:HOLT MCDOUGALPublisher:HOLT MCDOUGAL