Subpart (a):
Revenues, costs and profits.
Subpart (a):
Explanation of Solution
Table -1 shows the total quantity and respective
Table -1
| Price | Quantity |
| 100 | 0 |
| 90 | 100,000 |
| 80 | 200,000 |
| 70 | 300,000 |
| 60 | 400,000 |
| 50 | 500,000 |
| 40 | 600,000 |
| 30 | 700,000 |
| 20 | 800,000 |
| 10 | 900,000 |
| 0 | 1,000,000 |
Total revenue can be calculated by using the following formula.
Substitute the respective values in Equation (1) to calculate the total revenue at price $90.
Total revenue is $9,000,000.
Total cost can be calculated by using the following formula.
Substitute the respective values in Equation (2) to calculate the total cost at quantity 100,000 units.
Total cost is $2,000,000.
Profit can be calculated by using the following formula.
Substitute the respective values in Equation (3) to calculate the profit for the quantity 100,000 units.
Profit is 7,000,000.
Table -2 shows the total revenue, total cost and profit that are obtained by using Equations (1), (2) and (3).
Table -2
| Price | Quantity | Total revenue | Total cost | Profit |
| 100 | 0 | 0 | 2,000,000 | -2,000,000 |
| 90 | 100,000 | 9,000,000 | 3,000,000 | 6,000,000 |
| 80 | 200,000 | 16,000,000 | 4,000,000 | 12,000,000 |
| 70 | 300,000 | 21,000,000 | 5,000,000 | 16,000,000 |
| 60 | 400,000 | 24,000,000 | 6,000,000 | 18,000,000 |
| 50 | 500,000 | 25,000,000 | 7,000,000 | 18,000,000 |
| 40 | 600,000 | 24,000,000 | 8,000,000 | 16,000,000 |
| 30 | 700,000 | 21,000,000 | 9,000,000 | 12,000,000 |
| 20 | 800,000 | 16,000,000 | 10,000,000 | 6,000,000 |
| 10 | 900,000 | 9,000,000 | 11,000,000 | -2,000,000 |
| 0 | 1,000,000 | 0 | 12,000,000 | -12,000,000 |
The maximum profit of $18 million is obtained at a quantity of 500,000 at a price of $50. Thus, the
Concept introduction:
Profit: Profit refers to the excess revenue after subtracting the total cost from the total revenue.
Total revenue: Total revenue refers to the revenue of a firm through its total sale of goods.
Total cost: Total cost refers to the cost of all the inputs used by the firm. It includes both the fixed cost and the variable costs.
Subpart (b):
Calculate marginal revenue.
Subpart (b):
Explanation of Solution
Marginal revenue can be calculated as follows:
Substitute the respective values in equation (4) to calculate the marginal revenue at price level $60.
Marginal revenue is $30.
Table -3 shows the marginal revenue that obtained by using equation (4).
Table -3
| Price | Quantity | Total revenue | Marginal revenue |
| 100 | 0 | 0 | - |
| 90 | 100,000 | 9,000,000 | $90 |
| 80 | 200,000 | 16,000,000 | 70 |
| 70 | 300,000 | 21,000,000 | 50 |
| 60 | 400,000 | 24,000,000 | 30 |
| 50 | 500,000 | 25,000,000 | 10 |
| 40 | 600,000 | 24,000,000 | -10 |
| 30 | 700,000 | 21,000,000 | -30 |
| 20 | 800,000 | 16,000,000 | -50 |
| 10 | 900,000 | 9,000,000 | -70 |
| 0 | 1,000,000 | 0 | -90 |
From table 4, it can be inferred that Marginal Revenue is less than price. Since the demand curve slopes downwards, Price declines when quantity rises. The marginal revenue declines even more than price because the firm loses revenue on all the units of the good sold when it lowers the price.
Concept introduction:
Marginal revenue: Marginal revenue refers to the amount of extra revenue attained in the process of increasing one more unit of output.
Subpart (c):
Profit maximization.
Subpart (c):
Explanation of Solution
Figure 1illustrates the
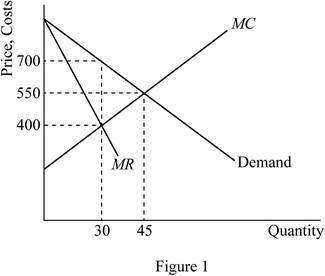
Figure 1 represents the marginal-revenue, marginal-cost, and demand curves. The horizontal axis represents the quantity and the vertical axis the prices, revenues and costs. The MR and MC curves cross between quantities of 400,000 and 500,000 which signify that the firm is maximizing profit in that region.
Concept introduction:
Marginal product of labor (MPL): Marginal product of labor refers to the additional output produced due to employing one more unit of labor.
Marginal product of capital (MPC): Marginal product of capital refers to the additional output produced due to employing one more unit of capital.
Profit maximization: A firm can maximize its profit at the point where its marginal revenue is equal to marginal cost.
Subpart (d):
Deadweight loss.
Subpart (d):
Explanation of Solution
The deadweight loss is depicted by area DWL in figure 1. Deadweight loss is greater in
Concept introduction:
Deadweight loss: Deadweight loss refers to loss of total economic benefit that arises due to the inefficient allocation of resource.
Subpart (e):
Change in profit.
Subpart (e):
Explanation of Solution
The price would not change if the author were paid $3 million instead of $2 million, the publisher since there would be no change in marginal cost or marginal revenue. The result would be a fall in the firm’s profit.
Concept introduction:
Profit: Profit refers to the excess revenue after subtracting the total cost from the total revenue.
Subpart (f):
Maximize economic efficiency.
Subpart (f):
Explanation of Solution
To maximize economic efficiency, the publisher would charge the price at $10 per book. This is because it is the marginal cost of the book. At price $10 per book, the publisher would receive negative profits equal to the amount paid to the author.
Concept introduction:
Economic efficiency: Economic efficiency is the situation where the economy is efficient. Which means that the marginal benefit from the last unit produced is equal to the marginal cost of production and the economic surplus will be at maximum.
Want to see more full solutions like this?
Chapter 15 Solutions
EBK PRINCIPLES OF MICROECONOMICS

- Test Preparation QUESTION 2 [20] 2.1 Body Mass Index (BMI) is a summary measure of relative health. It is calculated by dividing an individual's weight (in kilograms) by the square of their height (in meters). A small sample was drawn from the population of UWC students to determine the effect of exercise on BMI score. Given the following table, find the constant and slope parameters of the sample regression function of BMI = f(Weekly exercise hours). Interpret the two estimated parameter values. X (Weekly exercise hours) Y (Body-Mass index) QUESTION 3 2 4 6 8 10 12 41 38 33 27 23 19 Derek investigates the relationship between the days (per year) absent from work (ABSENT) and the number of years taken for the worker to be promoted (PROMOTION). He interviewed a sample of 22 employees in Cape Town to obtain information on ABSENT (X) and PROMOTION (Y), and derived the following: ΣΧ ΣΥ 341 ΣΧΥ 176 ΣΧ 1187 1012 3.1 By using the OLS method, prove that the constant and slope parameters of the…arrow_forwardQUESTION 2 2.1 [30] Mariana, a researcher at the World Health Organisation (WHO), collects information on weekly study hours (HOURS) and blood pressure level when writing a test (BLOOD) from a sample of university students across the country, before running the regression BLOOD = f(STUDY). She collects data from 5 students as listed below: X (STUDY) 2 Y (BLOOD) 4 6 8 10 141 138 133 127 123 2.1.1 By using the OLS method and the information above derive the values for parameters B1 and B2. 2.1.2 Derive the RSS (sum of squares for the residuals). 2.1.3 Hence, calculate ô 2.2 2.3 (6) (3) Further, she replicates her study and collects data from 122 students from a rival university. She derives the residuals followed by computing skewness (S) equals -1.25 and kurtosis (K) equals 8.25 for the rival university data. Conduct the Jacque-Bera test of normality at a = 0.05. (5) Upon tasked with deriving estimates of ẞ1, B2, 82 and the standard errors (SE) of ẞ1 and B₂ for the replicated data.…arrow_forwardIf you were put in charge of ensuring that the mining industry in canada becomes more sustainable over the course of the next decade (2025-2035), how would you approach this? Come up with (at least) one resolution for each of the 4 major types of conflict: social, environmental, economic, and politicalarrow_forward
- How is the mining industry related to other Canadian labour industries? Choose one other industry, (I chose Forestry)and describe how it is related to the mining industry. How do the two industries work together? Do they ever conflict, or do they work well together?arrow_forwardWhat is the primary, secondary, tertiary, and quaternary levels of mining in Canada For each level, describe what types of careers are the most common, and describe what stage your industry’s main resource is in during that stagearrow_forwardHow does the mining industry in canada contribute to the Canadian economy? Describe why your industry is so important to the Canadian economy What would happen if your industry disappeared, or suffered significant layoffs?arrow_forward
- What is already being done to make mining in canada more sustainable? What efforts are being made in order to make mining more sustainable?arrow_forwardWhat are the environmental challenges the canadian mining industry face? Discuss current challenges that mining faces with regard to the environmentarrow_forwardWhat sustainability efforts have been put forth in the mining industry in canada Are your industry’s resources renewable or non-renewable? How do you know? Describe your industry’s reclamation processarrow_forward
- How does oligopolies practice non-price competition in South Africa?arrow_forwardWhat are the advantages and disadvantages of oligopolies on the consumers, businesses and the economy as a whole?arrow_forward1. After the reopening of borders with mainland China following the COVID-19 lockdown, residents living near the border now have the option to shop for food on either side. In Hong Kong, the cost of food is at its listed price, while across the border in mainland China, the price is only half that of Hong Kong's. A recent report indicates a decline in food sales in Hong Kong post-reopening. ** Diagrams need not be to scale; Focus on accurately representing the relevant concepts and relationships rather than the exact proportions. (a) Using a diagram, explain why Hong Kong's food sales might have dropped after the border reopening. Assume that consumers are indifferent between purchasing food in Hong Kong or mainland China, and therefore, their indifference curves have a slope of one like below. Additionally, consider that there are no transport costs and the daily food budget for consumers is identical whether they shop in Hong Kong or mainland China. I 3. 14 (b) In response to the…arrow_forward
 Essentials of Economics (MindTap Course List)EconomicsISBN:9781337091992Author:N. Gregory MankiwPublisher:Cengage Learning
 Microeconomics: Private and Public Choice (MindTa...EconomicsISBN:9781305506893Author:James D. Gwartney, Richard L. Stroup, Russell S. Sobel, David A. MacphersonPublisher:Cengage Learning
 Economics: Private and Public Choice (MindTap Cou...EconomicsISBN:9781305506725Author:James D. Gwartney, Richard L. Stroup, Russell S. Sobel, David A. MacphersonPublisher:Cengage Learning
 Principles of Economics 2eEconomicsISBN:9781947172364Author:Steven A. Greenlaw; David ShapiroPublisher:OpenStax
 Managerial Economics: Applications, Strategies an...EconomicsISBN:9781305506381Author:James R. McGuigan, R. Charles Moyer, Frederick H.deB. HarrisPublisher:Cengage Learning