Subpart (a):
Revenues, costs and profits.
Subpart (a):
Explanation of Solution
Table -1 shows the total quantity and respective
Table -1
| Price | Quantity |
| 100 | 0 |
| 90 | 100,000 |
| 80 | 200,000 |
| 70 | 300,000 |
| 60 | 400,000 |
| 50 | 500,000 |
| 40 | 600,000 |
| 30 | 700,000 |
| 20 | 800,000 |
| 10 | 900,000 |
| 0 | 1,000,000 |
Total revenue can be calculated by using the following formula.
Substitute the respective values in Equation (1) to calculate the total revenue at price $90.
Total revenue is $9,000,000.
Total cost can be calculated by using the following formula.
Substitute the respective values in Equation (2) to calculate the total cost at quantity 100,000 units.
Total cost is $2,000,000.
Profit can be calculated by using the following formula.
Substitute the respective values in Equation (3) to calculate the profit for the quantity 100,000 units.
Profit is 7,000,000.
Table -2 shows the total revenue, total cost and profit that are obtained by using Equations (1), (2) and (3).
Table -2
| Price | Quantity | Total revenue | Total cost | Profit |
| 100 | 0 | 0 | 2,000,000 | -2,000,000 |
| 90 | 100,000 | 9,000,000 | 3,000,000 | 6,000,000 |
| 80 | 200,000 | 16,000,000 | 4,000,000 | 12,000,000 |
| 70 | 300,000 | 21,000,000 | 5,000,000 | 16,000,000 |
| 60 | 400,000 | 24,000,000 | 6,000,000 | 18,000,000 |
| 50 | 500,000 | 25,000,000 | 7,000,000 | 18,000,000 |
| 40 | 600,000 | 24,000,000 | 8,000,000 | 16,000,000 |
| 30 | 700,000 | 21,000,000 | 9,000,000 | 12,000,000 |
| 20 | 800,000 | 16,000,000 | 10,000,000 | 6,000,000 |
| 10 | 900,000 | 9,000,000 | 11,000,000 | -2,000,000 |
| 0 | 1,000,000 | 0 | 12,000,000 | -12,000,000 |
The maximum profit of $18 million is obtained at a quantity of 500,000 at a price of $50. Thus, the
Concept introduction:
Profit: Profit refers to the excess revenue after subtracting the total cost from the total revenue.
Total revenue: Total revenue refers to the revenue of a firm through its total sale of goods.
Total cost: Total cost refers to the cost of all the inputs used by the firm. It includes both the fixed cost and the variable costs.
Subpart (b):
Calculate marginal revenue.
Subpart (b):
Explanation of Solution
Marginal revenue can be calculated as follows:
Substitute the respective values in equation (4) to calculate the marginal revenue at price level $60.
Marginal revenue is $30.
Table -3 shows the marginal revenue that obtained by using equation (4).
Table -3
| Price | Quantity | Total revenue | Marginal revenue |
| 100 | 0 | 0 | - |
| 90 | 100,000 | 9,000,000 | $90 |
| 80 | 200,000 | 16,000,000 | 70 |
| 70 | 300,000 | 21,000,000 | 50 |
| 60 | 400,000 | 24,000,000 | 30 |
| 50 | 500,000 | 25,000,000 | 10 |
| 40 | 600,000 | 24,000,000 | -10 |
| 30 | 700,000 | 21,000,000 | -30 |
| 20 | 800,000 | 16,000,000 | -50 |
| 10 | 900,000 | 9,000,000 | -70 |
| 0 | 1,000,000 | 0 | -90 |
From table 4, it can be inferred that Marginal Revenue is less than price. Since the demand curve slopes downwards, Price declines when quantity rises. The marginal revenue declines even more than price because the firm loses revenue on all the units of the good sold when it lowers the price.
Concept introduction:
Marginal revenue: Marginal revenue refers to the amount of extra revenue attained in the process of increasing one more unit of output.
Subpart (c):
Profit maximization.
Subpart (c):
Explanation of Solution
Figure 1illustrates the
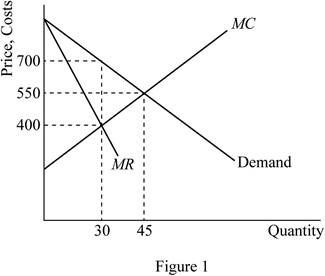
Figure 1 represents the marginal-revenue, marginal-cost, and demand curves. The horizontal axis represents the quantity and the vertical axis the prices, revenues and costs. The MR and MC curves cross between quantities of 400,000 and 500,000 which signify that the firm is maximizing profit in that region.
Concept introduction:
Marginal product of labor (MPL): Marginal product of labor refers to the additional output produced due to employing one more unit of labor.
Marginal product of capital (MPC): Marginal product of capital refers to the additional output produced due to employing one more unit of capital.
Profit maximization: A firm can maximize its profit at the point where its marginal revenue is equal to marginal cost.
Subpart (d):
Deadweight loss.
Subpart (d):
Explanation of Solution
The deadweight loss is depicted by area DWL in figure 1. Deadweight loss is greater in
Concept introduction:
Deadweight loss: Deadweight loss refers to loss of total economic benefit that arises due to the inefficient allocation of resource.
Subpart (e):
Change in profit.
Subpart (e):
Explanation of Solution
The price would not change if the author were paid $3 million instead of $2 million, the publisher since there would be no change in marginal cost or marginal revenue. The result would be a fall in the firm’s profit.
Concept introduction:
Profit: Profit refers to the excess revenue after subtracting the total cost from the total revenue.
Subpart (f):
Maximize economic efficiency.
Subpart (f):
Explanation of Solution
To maximize economic efficiency, the publisher would charge the price at $10 per book. This is because it is the marginal cost of the book. At price $10 per book, the publisher would receive negative profits equal to the amount paid to the author.
Concept introduction:
Economic efficiency: Economic efficiency is the situation where the economy is efficient. Which means that the marginal benefit from the last unit produced is equal to the marginal cost of production and the economic surplus will be at maximum.
Want to see more full solutions like this?
Chapter 15 Solutions
Bundle: Principles of Economics, Loose-leaf Version, 8th + LMS Integrated MindTap Economics, 2 terms (12 months) Printed Access Card

- Published in 1980, the book Free to Choose discusses how economists Milton Friedman and Rose Friedman proposed a one-sided view of the benefits of a voucher system. However, there are other economists who disagree about the potential effects of a voucher system.arrow_forwardThe following diagram illustrates the demand and marginal revenue curves facing a monopoly in an industry with no economies or diseconomies of scale. In the short and long run, MC = ATC. a. Calculate the values of profit, consumer surplus, and deadweight loss, and illustrate these on the graph. b. Repeat the calculations in part a, but now assume the monopoly is able to practice perfect price discrimination.arrow_forwardThe projects under the 'Build, Build, Build' program: how these projects improve connectivity and ease of doing business in the Philippines?arrow_forward
- Critically analyse the five (5) characteristics of Ubuntu and provide examples of how they apply to the National Health Insurance (NHI) in South Africa.arrow_forwardCritically analyse the five (5) characteristics of Ubuntu and provide examples of how they apply to the National Health Insurance (NHI) in South Africa.arrow_forwardOutline the nine (9) consumer rights as specified in the Consumer Rights Act in South Africa.arrow_forward
 Essentials of Economics (MindTap Course List)EconomicsISBN:9781337091992Author:N. Gregory MankiwPublisher:Cengage Learning
 Microeconomics: Private and Public Choice (MindTa...EconomicsISBN:9781305506893Author:James D. Gwartney, Richard L. Stroup, Russell S. Sobel, David A. MacphersonPublisher:Cengage Learning
 Economics: Private and Public Choice (MindTap Cou...EconomicsISBN:9781305506725Author:James D. Gwartney, Richard L. Stroup, Russell S. Sobel, David A. MacphersonPublisher:Cengage Learning
 Principles of Economics 2eEconomicsISBN:9781947172364Author:Steven A. Greenlaw; David ShapiroPublisher:OpenStax
 Managerial Economics: Applications, Strategies an...EconomicsISBN:9781305506381Author:James R. McGuigan, R. Charles Moyer, Frederick H.deB. HarrisPublisher:Cengage Learning