
Concept explainers
Videos
a.
Design a low pass filter for a given specification.
a.
Answer to Problem 1P
The obtained value of resistor
Explanation of Solution
Given data:
The value of capacitor
The value of passband gain is
Cutoff frequency is
Formula used:
Refer to Figure 15.1 in the textbook for a first order low-pass filter.
Write the expression for passband gain.
Here,
Write the expression for cutoff frequency.
Calculation:
Write the expression for
Re-arrange equation (2) as follows.
Substitute
Substitute
Convert dB value of passband gain into normal value.
Substitute
Conclusion:
Thus, the obtained value of resistor
b.
Draw the circuit diagram of designed low pass filter.
b.
Explanation of Solution
Calculation:
Modify the Figure 15.1 for designed value as shown in Figure 1.
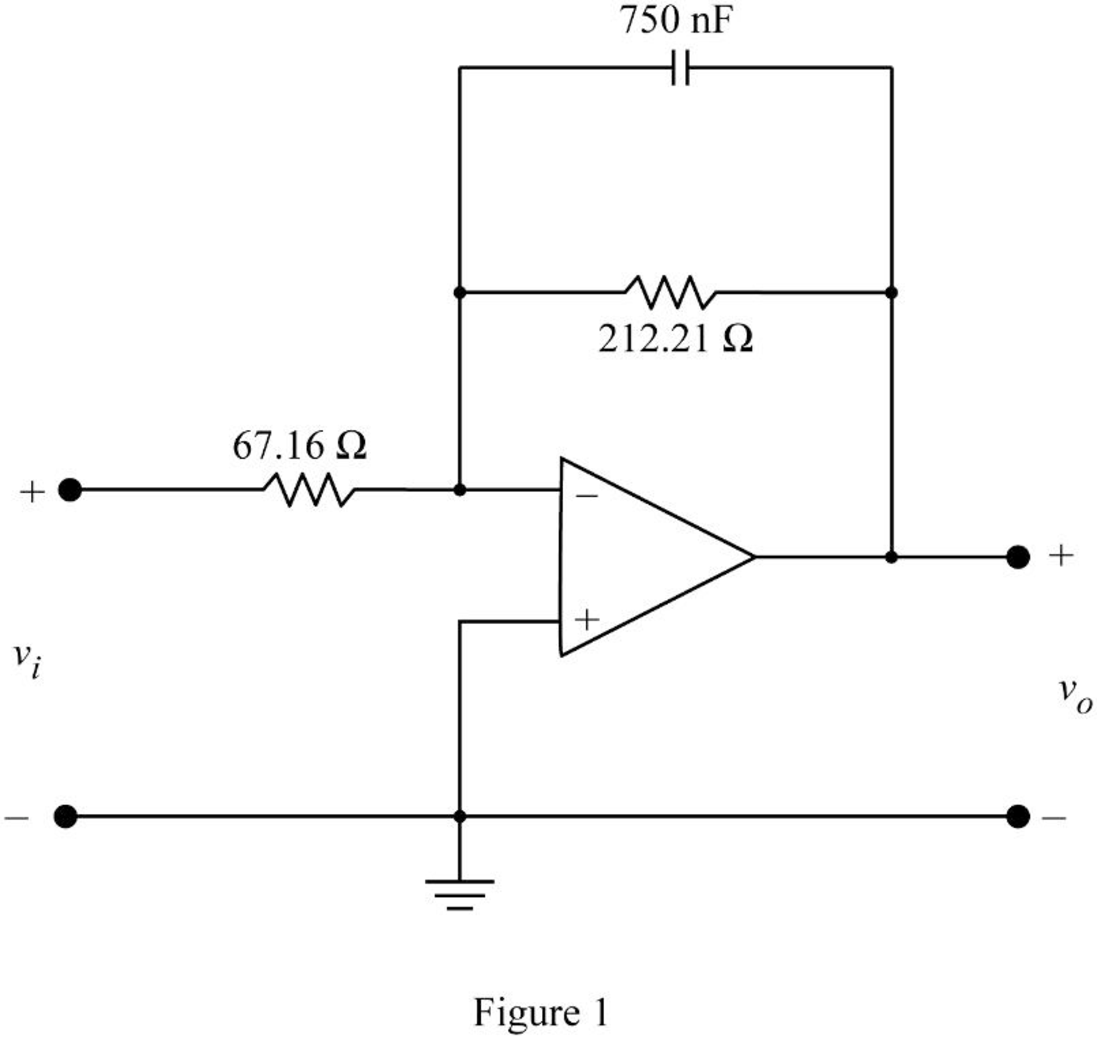
Conclusion:
Thus, the circuit diagram of designed low pass filter is shown in Figure 1.
Want to see more full solutions like this?
Chapter 15 Solutions
EBK ELECTRIC CIRCUITS


- help on this question about power electronics?arrow_forwardA speech signal has frequencies in the range 50- 3500 Hz. The signal is sampled at Nyquist sampling rate and the resulting pulses are transmitted over PAM and PCM systems. 1- Calculate the minimum bandwidth of the PAM system. 2- Calculate the minimum bandwidth of the PCM system, when the pulses are quantized into 121 levels B) Draw the signaling waveform (line codes) for the binary sequence 10110001 using (Unipolar NRZ, Bipolar RZ, Bipolar NRZ, Manchester code, Differential Manchester (split phase).arrow_forwardDon't use ai to answer I will report you answerarrow_forward
- Don't use ai to answer I will report you answerarrow_forward8-1) similar to Lathi & Ding, Prob. P.5.1-2 The figure below shows the Fourier spectra of signals of g,(t) and g₁(t). Determine the Nyquist rate and the corresponding sampling interval for signals of g,(t), g,(t), g₁(1) - g¸(1), g¸³(t), and g₁(1)g₁(1). Hint: Use the frequency convolution and the width property of convolution. G₁(f) G₂(f) -8000 0 8000 f -20000 10 20000 farrow_forward• We will use the Wattmeter to find the average power supplied/absorbed by each component. The following figure shows how to connect the Wattmeter to measure the average power absorbed by the resistor. Note that the Wattmeter consists of a Voltmeter and an Ammeter. The Voltmeter must be connected in parallel with the component and the Ammeter must be connected in series with the component. You must pay attention to the polarity of the voltage across the component as well as the direction of the current flowing through the component. 5Vpk 1kHz 30° ww 40 Z=A-JB Wattmeter-XWM1 2.503 W Power factor: 1.00000 Voltage Current • • Similarly connect a second Wattmeter to measure the average power supplied by the source. Connect a third Wattmeter to measure the average power in the capacitor. Does this value agree with the theoretical value? Perform Interactive Simulation under Analysis and Simulation. Double click on Wattmeters to see the average power values. Note that the Wattmeter also…arrow_forward
 Introductory Circuit Analysis (13th Edition)Electrical EngineeringISBN:9780133923605Author:Robert L. BoylestadPublisher:PEARSON
 Delmar's Standard Textbook Of ElectricityElectrical EngineeringISBN:9781337900348Author:Stephen L. HermanPublisher:Cengage Learning
 Programmable Logic ControllersElectrical EngineeringISBN:9780073373843Author:Frank D. PetruzellaPublisher:McGraw-Hill Education
 Fundamentals of Electric CircuitsElectrical EngineeringISBN:9780078028229Author:Charles K Alexander, Matthew SadikuPublisher:McGraw-Hill Education
 Electric Circuits. (11th Edition)Electrical EngineeringISBN:9780134746968Author:James W. Nilsson, Susan RiedelPublisher:PEARSON
 Engineering ElectromagneticsElectrical EngineeringISBN:9780078028151Author:Hayt, William H. (william Hart), Jr, BUCK, John A.Publisher:Mcgraw-hill Education,