
Concept explainers
Videos
Exercises 1 through 4 refer to the data set shown in Table 15-12. The table shows the scores on a Chem 103 test consisting of 10 questions worth 10 points each.
Chem 103 test scores.
Table 15-12
Chem 103 test scores
| Student ID | Score | Student ID | Score |
| 1362 | 50 | 4315 | 70 |
| 1486 | 70 | 4719 | 70 |
| 1721 | 80 | 4951 | 60 |
| 1932 | 60 | 5321 | 60 |
| 2489 | 70 | 5872 | 100 |
| 2766 | 10 | 6433 | 50 |
| 2877 | 80 | 6921 | 50 |
| 2964 | 60 | 8317 | 70 |
| 3217 | 70 | 8854 | 100 |
| 3588 | 80 | 8964 | 80 |
| 3780 | 80 | 9158 | 60 |
| 3921 | 60 | 9347 | 60 |
| 4107 | 40 |
a. Make a frequency table for the Chem 103 test scores.
b. Draw a bar graph for the data in Table 15-12.
a.
To find:
The frequency table for the Chem 103 test scores.
Answer to Problem 1E
Solution:
The frequency table for the Chem 103 test scores is given by,
| Score | Frequency |
| 10 | 1 |
| 40 | 1 |
| 50 | 3 |
| 60 | 7 |
| 70 | 6 |
| 80 | 5 |
| 100 | 2 |
Explanation of Solution
Given:
The table below shows the scores on a Chem 103 test consisting of 10 questions worth 10 points each.
| Student ID | Score | Student ID | Score |
| 1362 | 50 | 4315 | 70 |
| 1486 | 70 | 4719 | 70 |
| 1721 | 80 | 4951 | 60 |
| 1932 | 60 | 5321 | 60 |
| 2489 | 70 | 5872 | 100 |
| 2766 | 10 | 6433 | 50 |
| 2877 | 80 | 6921 | 50 |
| 2964 | 60 | 8317 | 70 |
| 3217 | 70 | 8854 | 100 |
| 3588 | 80 | 8964 | 80 |
| 3780 | 80 | 9158 | 60 |
| 3921 | 60 | 9347 | 60 |
| 4107 | 40 |
A frequency table is a table with the frequency of each actual value in the data set.
Approach:
From the given table the number of students with a score of 10 is 1, so the frequency of score 10 is 1, similarly the number of students with a score of 40 is 1, so the frequency of score 40 is 1 similarly frequencies for rest of scores can be computed.
The frequency table for the Chem 103 test is given by,
| Score | Frequency |
| 10 | 1 |
| 40 | 1 |
| 50 | 3 |
| 60 | 7 |
| 70 | 6 |
| 80 | 5 |
| 100 | 2 |
b)
To construct:
The bar graph corresponding to the given table.
Answer to Problem 1E
Solution:
The bar graph is given below.

Explanation of Solution
Given:
The table below shows the scores on a Chem 103 test consisting of 10 questions worth 10 points each.
| Student ID | Score | Student ID | Score |
| 1362 | 50 | 4315 | 70 |
| 1486 | 70 | 4719 | 70 |
| 1721 | 80 | 4951 | 60 |
| 1932 | 60 | 5321 | 60 |
| 2489 | 70 | 5872 | 100 |
| 2766 | 10 | 6433 | 50 |
| 2877 | 80 | 6921 | 50 |
| 2964 | 60 | 8317 | 70 |
| 3217 | 70 | 8854 | 100 |
| 3588 | 80 | 8964 | 80 |
| 3780 | 80 | 9158 | 60 |
| 3921 | 60 | 9347 | 60 |
| 4107 | 40 |
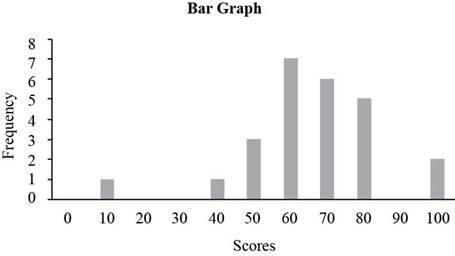
A bar graph is a graph with bars (column) representing each of the actual values in the data set. The height of each column represents the frequency of the value in the data set.
Approach:
From the given table the number of students with a score of 0 is 0, so the frequency of score 0 is 0, similarly the number of students with a score of 10 is 1, so the frequency of score 10 is 1 similarly frequencies for rest of scores can be computed.
The frequency table for the Chem 103 test is given by,
| Score | Frequency |
| 0 | 0 |
| 10 | 1 |
| 20 | 0 |
| 30 | 0 |
| 40 | 1 |
| 50 | 3 |
| 60 | 7 |
| 70 | 6 |
| 80 | 5 |
| 90 | 0 |
| 100 | 2 |
Place the scores along horizontal axis and the frequencies along vertical axis to construct bar graph. The bar graph of the frequency table is given below.
Want to see more full solutions like this?
Chapter 15 Solutions
Excursions in Modern Mathematics (9th Edition)
Additional Math Textbook Solutions
Pathways To Math Literacy (looseleaf)
Finite Mathematics for Business, Economics, Life Sciences and Social Sciences
Introductory Statistics
Elementary & Intermediate Algebra
Algebra and Trigonometry (6th Edition)
Calculus: Early Transcendentals (2nd Edition)


- [J) Hwk 25 Hwk 25 - (MA 244-03) (SP25) || X Answered: Homework#7 | bartle X + https://www.webassign.net/web/Student/Assignment-Responses/last?dep=36606604 1. [-/4 Points] DETAILS MY NOTES Find the matrix A' for T relative to the basis B'. LARLINALG8 6.4.003. T: R² → R², T(x, y) = (x + y, 4y), B' = {(−4, 1), (1, −1)} A' = Need Help? Read It Watch It SUBMIT ANSWER 2. [-/4 Points] DETAILS MY NOTES LARLINALG8 6.4.007. Find the matrix A' for T relative to the basis B'. T: R³ → R³, T(x, y, z) = (x, y, z), B' = {(0, 1, 1), (1, 0, 1), (1, 1, 0)} A' = ↓ ↑ Need Help? Read It SUBMIT ANSWER 具⇧ ASK YOUR TEACHER PRACTICE ANOTHER ill ASK YOUR TEACHER PRACTICE ANOTHER 3. [-/4 Points] DETAILS MY NOTES LARLINALG8 6.4.013. ASK YOUR TEACHER PRACTICE ANOTHERarrow_forwardUse Laplace transforms to solve the following heat problem: U₁ = Urr x > 0, t> 0 u(x, 0) = 10c a -X u(0,t) = 0 lim u(x,t) = 0 I7Xarrow_forward1) Given matrix A below, answer the following questions: a) What is the order of the matrix? b) What is the element a13? c) What is the element a₁₁? 4 -1arrow_forward
- [25 points] Given the vector let v = ER² and the collection of vectors ε = E-{)·()}-{☹) (9)} = {(A)·(9)}· B: = and C = · {(6)·(})}· answer the following question. (a) (b) (c) (d) (e) verify Verify is a basis for R² and find the coordinate [] of under ε. Verify B is a basis for R2 and find the coordinate []B of ʊ Verify C is a basis for R2 and find the coordinate []c of under ε. under ε. Find the change-of-basis matrix [I]+B from basis B to basis ε, and EE+BUB Find the change-of-basis matrix [I]B+ε from basis Ɛ to basis B, and verify [U]B= [] B+EVEarrow_forwardExplain the following terms | (a) linear span (b) dimension of vector space (c) linearly independent (d) linearly dependent (e) rank of matrix Aarrow_forward3. Let u = 3/5 √ = and = -4/5 -() Define V span{ū, }. (a) (b) (c) Show that {u, } is orthonormal and forms a basis for V. Explicitly compute Projy w. Explicitly give a non-zero vector in V+.arrow_forward
- Is 1.1 0.65 -3.4 0.23 0.4 -0.44 a basis for R3? You must explain your answer 0arrow_forwardCan you help me solve problem 38 with steps im stuck.arrow_forwardFind the tangent line approximation 7 to the graph of f at the given point. T(x) = f(x) = csc(x), (8, csc(8)) Complete the table. (Round your answers to four decimal places.) x f(x) T(x) 7.9 7.99 8 8.01 8.1arrow_forward
- How do the samples hold up to the efficiency test? What percentages of the samples pass or fail the test? What would be the likelihood of having the following specific number of efficiency test failures in the next 300 processors tested? 1 failures, 5 failures, 10 failures and 20 failures.arrow_forwardCan you solve it numerical methodarrow_forwardUse the information to find and compare Ay and dy. (Round your answers to four decimal places.) Function x-Value Differential of x Ду = dy = y = x² + 2 x = -4 Ax = dx = 0.01arrow_forward
 Holt Mcdougal Larson Pre-algebra: Student Edition...AlgebraISBN:9780547587776Author:HOLT MCDOUGALPublisher:HOLT MCDOUGAL
 Glencoe Algebra 1, Student Edition, 9780079039897...AlgebraISBN:9780079039897Author:CarterPublisher:McGraw Hill
 Functions and Change: A Modeling Approach to Coll...AlgebraISBN:9781337111348Author:Bruce Crauder, Benny Evans, Alan NoellPublisher:Cengage Learning
 Big Ideas Math A Bridge To Success Algebra 1: Stu...AlgebraISBN:9781680331141Author:HOUGHTON MIFFLIN HARCOURTPublisher:Houghton Mifflin Harcourt