Bundle: Microeconomic Theory: Basic Principles and Extensions, 12th + MindTap Economics, 1 term (6 months) Printed Access Card
12th Edition
ISBN: 9781337198202
Author: NICHOLSON, Walter, Snyder, Christopher M.
Publisher: Cengage Learning
bartleby

Concept explainers

Question
Book Icon
Chapter 15, Problem 15.1P

a)

To determine

Profit maximizing price quantity combination and corresponding profits for the monopolist

a)

Expert Solution
Check Mark

Explanation of Solution

Demand curve, Q=150P and costs is 0 .

Therefore, profits are,

π=PQ

=(150P)P

=150PP2

Differentiating the profit equation with respect to P to find the optimal value of P that maximises the profit for the monopolist. First order condition,

π=0

π=1502P=0

P=75

Q=15075=75

Second order condition, proves that this price and quantity maximizes the profits for a monopolist.

And profits given this price and quantity is,

π=PQ

=5625

b)

To determine

Nash equilibrium output for two firms operating in Cournot model. Also to compute

market output, price and firms profits.

b)

Expert Solution
Check Mark

Explanation of Solution

From the demand function, we get, P=150Q

Also, Q=q1+q2

So, profit for the firm 1 ,

π1=(150q1q2)q1

Differentiating with respect to q1 , to get the value of q1 that maximises the profits for firm 1. First order condition,

π1=1502q1q2=0

=2q1+q2=150

And similarly, profit equation of the firm 2 reveals,

=2q1+q2=150 (2)

Solving 1 and 2 we get, q1+q2=50

Market output will be, Q=100

And market price is,

P=150100=50

So, at P=50 and q1=q2=50

The profits for firm 1 is,

π1=50×50=2500

The profit for firm 2 is,

π2=50×50=2500

c)

To determine

To find Nash equilibrium prices in a Bertrand model. Also to compute firm output and profits as well as market output.

c)

Expert Solution
Check Mark

Explanation of Solution

In case of a Bertrand model, undercutting of prices by both the firms leads to price becoming approximately nil in the given scenario. Hence the price will tend to zero, and quantity will become tending to 150 .

So, price =0

And Quantity =150

As there are no cost to production so firms will undercut to a level that at the end of the day both firms will be willing to provide the quantity at price 0 .

Profits for the firm =0

And market output is,

=150+150=300

However the maximum demand is only for 150 units, therefore market output is 150 .

d)

To determine

To graph the demand curve for cases in parts (a), (b), (c).

d)

Expert Solution
Check Mark

Explanation of Solution

Bundle: Microeconomic Theory: Basic Principles and Extensions, 12th + MindTap Economics, 1 term (6 months) Printed Access Card, Chapter 15, Problem 15.1P

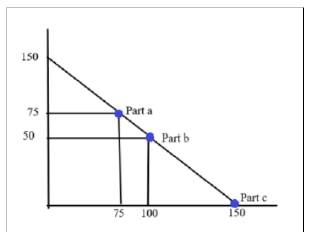
In the above diagram, Price is measured on y -axis and quantity is measured on x -axis. In part a , where the firm is a monopolist produces 75 units of quantity and sells it at $75 per unit.

In part b , there are two firms, so price gets reduced to $50 per unit and quantity produced is 100 units.

In part c, the two firms follows Bertand equilibrium model, quantity produced is 150 units with 0 price per unit.

Want to see more full solutions like this?

Subscribe now to access step-by-step solutions to millions of textbook problems written by subject matter experts!
Students have asked these similar questions
As indicated in the attached image, U.S. earnings for high- and low-skill workers as measured by educational attainment began diverging in the 1980s. The remaining questions in this problem set use the model for the labor market developed in class to walk through potential explanations for this trend.  1. Assume that there are just two types of workers, low- and high-skill. As a result, there are two labor markets: supply and demand for low-skill workers and supply and demand for high-skill workers. Using two carefully drawn labor-market figures, show that an increase in the demand for high skill workers can explain an increase in the relative wage of high-skill workers.  2. Using the same assumptions as in the previous question, use two carefully drawn labor-market figures to show that an increase in the supply of low-skill workers can explain an increase in the relative wage of high-skill workers.
Published in 1980, the book Free to Choose discusses how economists Milton Friedman and Rose Friedman proposed a one-sided view of the benefits of a voucher system. However, there are other economists who disagree about the potential effects of a voucher system.
The following diagram illustrates the demand and marginal revenue curves facing a monopoly in an industry with no economies or diseconomies of scale. In the short and long run, MC = ATC. a. Calculate the values of profit, consumer surplus, and deadweight loss, and illustrate these on the graph. b. Repeat the calculations in part a, but now assume the monopoly is able to practice perfect price discrimination.
Knowledge Booster
Background pattern image
Economics
Learn more about
Need a deep-dive on the concept behind this application? Look no further. Learn more about this topic, economics and related others by exploring similar questions and additional content below.
Recommended textbooks for you
Text book image
Microeconomic Theory
Economics
ISBN:9781337517942
Author:NICHOLSON
Publisher:Cengage
Text book image
Managerial Economics: Applications, Strategies an...
Economics
ISBN:9781305506381
Author:James R. McGuigan, R. Charles Moyer, Frederick H.deB. Harris
Publisher:Cengage Learning
Text book image
Micro Economics For Today
Economics
ISBN:9781337613064
Author:Tucker, Irvin B.
Publisher:Cengage,
Text book image
Economics For Today
Economics
ISBN:9781337613040
Author:Tucker
Publisher:Cengage Learning
Text book image
Survey Of Economics
Economics
ISBN:9781337111522
Author:Tucker, Irvin B.
Publisher:Cengage,
Text book image
Survey of Economics (MindTap Course List)
Economics
ISBN:9781305260948
Author:Irvin B. Tucker
Publisher:Cengage Learning