
Concept explainers
Types of kinematic surveys.
Answer to Problem 15.1P
Types of kinematic
1. Real time kinematic survey
2. Post process kinematic survey
Explanation of Solution
Surveying plays is an important role in all engineering projects. By measuring the horizontal and vertical direction and angle, it is an art and science to find the relative position of various valuable points or stations on the earth's surface. We prepare plans, maps, or layout by these points.
The most effective and fastest survey technique is Kinematic surveying. The relative positioning technique is used for the observation of the carrier phase shift. The cinematic survey can provide the coordinate of the points with the fastest values while the receiver is motionless or in motion.
The two types of kinematic survey are:
1. Real time kinematic survey
The Real time kinematic survey (RTK) is also referred to as the relative positioning technique that measures the position in real time using two global navigation satellite systems (GNSS). One is placed at a static point with established coordinates and is known as the base station. It carries a large frequency radio to the second unit (known as the rover) with its raw observation and the rover carries both observations to determine a position relative to the base location in real time.
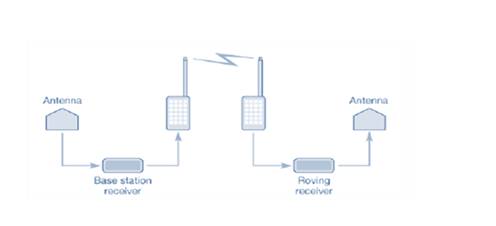
RTK surveying requires positive communication between base and rover units and works best with short baselines as the accuracy of measurements or analysis of RTK decreases as the length of the baseline increases.
2. Post process kinematic survey
A post process kinematic survey requires a base receiver that collects data at the same time rate as the rover. In the Kinematic survey of post processes, the identified coordinates should be stored in the survey controller and the observations of the raw global navigation satellite system (GNSS) are saved in the recipient until the fieldwork is completed. The data are then processed by the same software and processing techniques used in static surveys in the office.
Want to see more full solutions like this?
Chapter 15 Solutions
Elementary Surveying: An Introduction to Geomatics (15th Edition)


- please helparrow_forwardAS Q1/ The specific gravity of the soil is 1.41 percentage of water content by weight at field capacity and wilting point are 15% and 7% respectively calculate the equivalent moisture content as equivalent depth for 1.2m root zone : 1. at permanent wilting point 2. at field capacity 3. for ready available waterarrow_forwardQuestion 6 The following figure shows peak-hour volumes for an intersection. Using Webster's method, determine a suitable signal timing for the intersection using the four-phase system shown below. Use an amber interval of 3 seconds and the saturation flow given in the table. O 100 O Phase Lime Group Saturation Flow A e 1615-> 370 3700 B 1615 1615 3700 1615 3700arrow_forward
- PHF-0.91 Pedestrian volume is negligible. Question 7 A parking area with 60 bays has an initial count of 35 vehicles. The in-out survey data for 10-minute intervals is as per the table below. Complete the table, calculate the accumulation, occupancy (%), and parking load (veh.hrs) for each interval. Time (min) In Out Accumulation Occupancy Parking load (%) 0 3 10 2 4 20 1 1 30 1 3 40 1 6 50 1 4 60arrow_forwardQ3/ The following data represent the water depth in the soil of equal areas for specified field. Calculate the uniformity coefficient, efficiency and adequacy of irrigation. Net needed irrigation depth =75 mm (78-04, 79, 88, 85.21, 76,82)arrow_forwardA (A) Q1/ It is required to apply a net depth of 120mm to a total area of 60 ha. The applied discharge is continuously 180 L/s. What must be the time of irrigation? Assume the application efficiency 85%. а Eas 85 0% tarrow_forward
- The following figure is a flexible pavement system with the resilient moduli layer coefficients and drainage coefficients as shown. If the predicted ESAL = 6x10⁶, Reliability, R = 99%, Standard Deviation (So) = 0.45, and APSI = 2.5, select thicknesses D1, D2, and D3 in accordance with the AASHTO Guide for Design of Pavement Structures. E₁ = 400, 000 psi; a₁ = 0.42, Thickness = D₁ E₂=30,000 psi; a₂= 0.14, m₂ = 1.2; Thickness = Dz E=11,000 psi; a=0.08, m3 = 1.2; Thickness = D3 MR= 5,700 psiarrow_forwardDiagramtically show the placement, size, and spacing of temperature steels, dowel bars and tie bars in rigid pavements. Also mention their puproses in rigid pavements.arrow_forwardA six-lane concrete roadway is being designed for a metropolitan area. This roadway will be constructed on a subgrade with an effective modulus of subgrade reaction k of 200 lb/in^3. The ESALs used for the design period is 6.0×10^6. Using the AASHTO design method, determine a suitable thickness of the concrete pavement (to the nearest 1/2 inch), provided that the working stress of the concrete to be used is 600 lb/in^2 and the modulus of elasticity is 6×10^6 lb/in^2. Assume the initial serviceability is 5.0 and the terminal serviceability is 2.0. Assume the overall standard deviation, So, is 0.35, the load transfer coefficient J as 3.2, the drainage coefficient, Cd, is 1.15, and R = 99%.arrow_forward
- A 12-in. full-depth asphalt pavement is placed on a subgrade with aneffective roadbed resilient modulus of 7,000 psi. Assuming a layer coefficient of 0.44 for the hot mix asphalt, a drop in PSI from 4.5 to 2.5, an overall standard deviation of 0.49, and a predicted ESAL of 10 X 10^6, determine the reliability of thedesign by using the AASHTO equation and check the result by using the AASHTO design chartarrow_forwardGiven the monthly resilient modulus below, find out relative damage of each month, the average relative damage and the effective roadbed resilient modulus.Month Resilient Modulus (psi):Jan 20,000Feb 22,000March 5,000April 6,000May 7,000June 8,000July 8,500August 9,500September 9,000October 8,000November 7,000December 18,000arrow_forwardDetermine the largest torque T that can be applied to each of the twoaluminium bars shown in Figure 5 below, and the corresponding angle of twistat B, knowing that allow = 50 MPa and G = 26 GPa. [10]Figure 5 : Aluminium Bars(Source: Mechanics of Materials Beer, Johnston, DeWolf & Mazurek 6Ed p204)arrow_forward

 Structural Analysis (10th Edition)Civil EngineeringISBN:9780134610672Author:Russell C. HibbelerPublisher:PEARSON
 Principles of Foundation Engineering (MindTap Cou...Civil EngineeringISBN:9781337705028Author:Braja M. Das, Nagaratnam SivakuganPublisher:Cengage Learning
 Fundamentals of Structural AnalysisCivil EngineeringISBN:9780073398006Author:Kenneth M. Leet Emeritus, Chia-Ming Uang, Joel LanningPublisher:McGraw-Hill Education
 Traffic and Highway EngineeringCivil EngineeringISBN:9781305156241Author:Garber, Nicholas J.Publisher:Cengage Learning