
Videos
An acid is titrated with NaOH. The following beakers are illustrations of the contents of the beaker at various times during the titration. These are presented out of order. Note: Counter-ions and water molecules have been omitted from the illustrations for clarity.
(a) 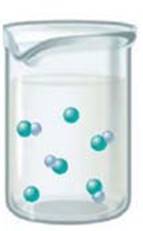
(b) 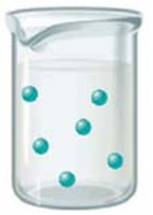
(c) 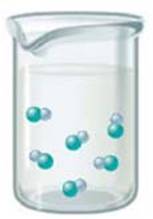
(d) 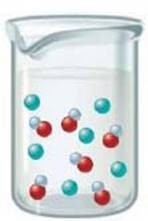
(e) 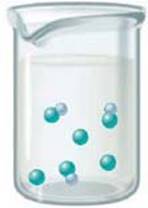
a. Is the acid a weak or strong acid? How can you tell?
b. Arrange the beakers in order of what the contents would look like as the titration progresses.
c. For which beaker would pH = pKa? Explain your answer.
d. Which beaker represents the equivalence point of the titration? Explain your answer.
e. For which beaker would the Ka value for the acid not be necessary to determine the pH? Explain your answer.

Trending nowThis is a popular solution!

Chapter 15 Solutions
Lab Manual For Zumdahl/zumdahl's Chemistry, 9th
Additional Science Textbook Solutions
Genetics: From Genes to Genomes
Fundamentals of Anatomy & Physiology (11th Edition)
MARINE BIOLOGY
Organic Chemistry
Campbell Essential Biology (7th Edition)


- What is the final product when D-galactose reacts with hydroxylamine?arrow_forwardIndicate the formula of the product obtained by reacting methyl 5-chloro-5-oxopentanoate with 1 mole of 4-penten-1-ylmagnesium bromide.arrow_forwardIn the two chair conformations of glucose, the most stable is the one with all the OH groups in the equatorial position. Is this correct?arrow_forward
- please help me with my homeworkarrow_forwardhelparrow_forwardThe temperature on a sample of pure X held at 1.25 atm and -54. °C is increased until the sample boils. The temperature is then held constant and the pressure is decreased by 0.42 atm. On the phase diagram below draw a path that shows this set of changes. pressure (atm) 2 0 0 200 400 temperature (K) Xarrow_forward
- QUESTION: Answer Question 5: 'Calculating standard error of regression' STEP 1 by filling in all the empty green boxes *The values are all provided in the photo attached*arrow_forwardpressure (atm) 3 The pressure on a sample of pure X held at 47. °C and 0.88 atm is increased until the sample condenses. The pressure is then held constant and the temperature is decreased by 82. °C. On the phase diagram below draw a path that shows this set of changes. 0 0 200 temperature (K) 400 аarrow_forwarder your payment details | bar xb Home | bartleby x + aleksogi/x/isl.exe/1o u-lgNskr7j8P3jH-1Qs_pBanHhviTCeeBZbufuBYT0Hz7m7D3ZcW81NC1d8Kzb4srFik1OUFhKMUXzhGpw7k1 O States of Matter Sketching a described thermodynamic change on a phase diagram 0/5 The pressure on a sample of pure X held at 47. °C and 0.88 atm is increased until the sample condenses. The pressure is then held constant and the temperature is decreased by 82. °C. On the phase diagram below draw a path that shows this set of changes. pressure (atm) 1 3- 0- 0 200 Explanation Check temperature (K) 400 X Q Search L G 2025 McGraw Hill LLC. All Rights Reserved Terms of Use Privacy Cearrow_forward

 Living By Chemistry: First Edition TextbookChemistryISBN:9781559539418Author:Angelica StacyPublisher:MAC HIGHER
 General, Organic, and Biological ChemistryChemistryISBN:9781285853918Author:H. Stephen StokerPublisher:Cengage Learning
 Chemistry for Engineering StudentsChemistryISBN:9781337398909Author:Lawrence S. Brown, Tom HolmePublisher:Cengage Learning
 Introductory Chemistry: A FoundationChemistryISBN:9781337399425Author:Steven S. Zumdahl, Donald J. DeCostePublisher:Cengage LearningChemistry: Matter and ChangeChemistryISBN:9780078746376Author:Dinah Zike, Laurel Dingrando, Nicholas Hainen, Cheryl WistromPublisher:Glencoe/McGraw-Hill School Pub Co