
Essentials Of Statistics For Business & Economics
9th Edition
ISBN: 9780357045435
Author: David R. Anderson, Dennis J. Sweeney, Thomas A. Williams, Jeffrey D. Camm, James J. Cochran
Publisher: South-Western College Pub
expand_more
expand_more
format_list_bulleted
Concept explainers
Videos
Textbook Question
Chapter 14.9, Problem 50E
Consider the following data for two variables, x and y.
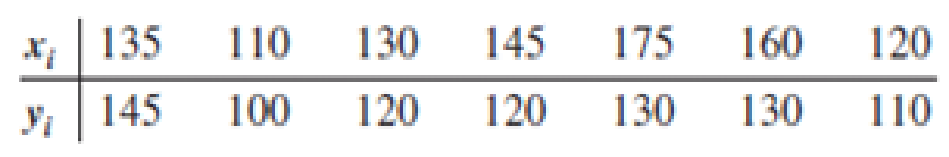
- a. Compute the standardized residuals for these data. Do the data include any outliers? Explain.
- b. Plot the standardized residuals against
- c. Develop a
scatter diagram for these data. Does the scatter diagram indicate any outliers in the data? In general, what implications does this finding have for simple linear regression?
Expert Solution & Answer
Want to see the full answer?
Check out a sample textbook solution
Students have asked these similar questions
ons
12. A sociologist hypothesizes that the crime rate is higher in areas
with higher poverty rate and lower median income. She col-
lects data on the crime rate (crimes per 100,000 residents),
the poverty rate (in %), and the median income (in $1,000s)
from 41 New England cities. A portion of the regression results
is shown in the following table.
Standard
Coefficients
error
t stat
p-value
Intercept
-301.62
549.71
-0.55 0.5864
Poverty
53.16
14.22
3.74 0.0006
Income
4.95
8.26
0.60 0.5526
a.
b.
Are the signs as expected on the slope coefficients?
Predict the crime rate in an area with a poverty rate of
20% and a median income of $50,000.
3. Using data from 50 work
2. The owner of several used-car dealerships believes that the
selling price of a used car can best be predicted using the car's
age. He uses data on the recent selling price (in $) and age of
20 used sedans to estimate Price = Po + B₁Age + ε. A portion
of the regression results is shown in the accompanying table.
Standard
Coefficients
Intercept
21187.94
Error
733.42
t Stat p-value
28.89 1.56E-16
Age
-1208.25
128.95 -9.37
2.41E-08
a. What is the estimate for B₁? Interpret this value.
b. What is the sample regression equation?
C. Predict the selling price of a 5-year-old sedan.
ian income of $50,000.
erty rate of
13. Using data from 50 workers, a researcher estimates Wage =
Bo+B,Education + B₂Experience + B3Age+e, where Wage
is the hourly wage rate and Education, Experience, and Age
are the years of higher education, the years of experience, and
the age of the worker, respectively. A portion of the regression
results is shown in the following table. ni ogolloo bash
1
Standard
Coefficients error
t stat p-value
Intercept
7.87
4.09
1.93
0.0603
Education
1.44
0.34
4.24 0.0001
Experience
0.45
0.14
3.16
0.0028
Age
-0.01
0.08 -0.14 0.8920
a. Interpret the estimated coefficients for Education and
Experience.
b. Predict the hourly wage rate for a 30-year-old worker
with four years of higher education and three years of
experience.
Chapter 14 Solutions
Essentials Of Statistics For Business & Economics
Ch. 14.2 - Given are five observations for two variables, x...Ch. 14.2 - Given are five observations for two variables, x...Ch. 14.2 - Given are five observations collected in a...Ch. 14.2 - Retail and Trade: Female Managers. The following...Ch. 14.2 - Production Line Speed and Quality Control. Brawdy...Ch. 14.2 - The National Football League (NFL) records a...Ch. 14.2 - Sales Experience and Performance. A sales manager...Ch. 14.2 - Broker Satisfaction. The American Association of...Ch. 14.2 - Estimating Landscaping Expenditures. David’s...Ch. 14.2 - Age and the Price of Wine. For a particular red...
Ch. 14.2 - Laptop Ratings. To help consumers in purchasing a...Ch. 14.2 - Stock Beta. In June of 2016, Yahoo Finance...Ch. 14.2 - Auditing Itemized Tax Deductions. To the Internal...Ch. 14.2 - Distance and Absenteeism. A large city hospital...Ch. 14.3 - 15. The data from exercise 1...Ch. 14.3 - Prob. 16ECh. 14.3 - The data from exercise 3 follow.
The estimated...Ch. 14.3 - Price and Quality of Headphones. The following...Ch. 14.3 - Prob. 19ECh. 14.3 - Price and Weight of Bicycles. Bicycling, the...Ch. 14.3 - Cost Estimation. An important application of...Ch. 14.3 - Prob. 22ECh. 14.5 - The data from exercise 1 follow.
Compute the mean...Ch. 14.5 - The data from exercise 2 follow.
Compute the mean...Ch. 14.5 - The data from exercise 3 follow.
What is the...Ch. 14.5 - Headphones Conclusion. In exercise 18, the data on...Ch. 14.5 - College CPA and Salary. Do students with higher...Ch. 14.5 - Broker Satisfaction Conclusion. In exercise 8,...Ch. 14.5 - Cost Estimation Conclusion. Refer to exercise 21,...Ch. 14.5 - Significance of Fleet Size on Rental Car Revenue....Ch. 14.5 - Significance of Racing Bike Weight on Price. In...Ch. 14.6 - The data from exercise 1 follow. xi 1 2 3 4 5 yi 3...Ch. 14.6 - Prob. 33ECh. 14.6 - 34. The data from exercise 3...Ch. 14.6 - Restaurant Lines. Many small restaurants in...Ch. 14.6 - 36. In exercise 7, the data on y = annual sales ($...Ch. 14.6 - In exercise 13, data were given on the adjusted...Ch. 14.6 - Prob. 38ECh. 14.6 - Entertainment Spend. The Wall Street Journal asked...Ch. 14.7 - Apartment Selling Price. The commercial division...Ch. 14.7 - Computer Maintenance. Following is a portion of...Ch. 14.7 - Annual Sales and Salesforce. A regression model...Ch. 14.7 - Estimating Setup Time. Sherry is a production...Ch. 14.7 - Auto Racing Helmet. Automobile racing,...Ch. 14.8 - Given are data for two variables, x and y. a....Ch. 14.8 - Prob. 46ECh. 14.8 - Restaurant Advertising and Revenue. Data on...Ch. 14.8 - Experience and Sales. Refer to exercise 7, where...Ch. 14.8 - Buy Versus Rent. Occasionally, it has been the...Ch. 14.9 - Consider the following data for two variables, x...Ch. 14.9 - Consider the following data for two variables, x...Ch. 14.9 - Predicting Charity Expenses. Charity Navigator is...Ch. 14.9 - Supermarket Checkout Lines. Retail chain Kroger...Ch. 14.9 - Valuation of a Major League Baseball Team. The...Ch. 14 - 55. Does a high value of r2 imply that two...Ch. 14 - Prob. 56SECh. 14 - What is the purpose of testing whether 1 = 0? If...Ch. 14 - Stock Market Performance. The Dow Jones Industrial...Ch. 14 - Home Sire and Price. Is the number of square feet...Ch. 14 - Online Education. One of the biggest changes in...Ch. 14 - Machine Maintenance. Jensen Tire & Auto is in the...Ch. 14 - Production Rate and Quality Control. In a...Ch. 14 - Absenteeism and Location. A sociologist was hired...Ch. 14 - Bus Maintenance. The regional transit authority...Ch. 14 - Studying and Grades. A marketing professor at...Ch. 14 - Market Beta. Market betas for individual stocks...Ch. 14 - Income and Percent Audited. The Transactional...Ch. 14 - Used Car Mileage and Price. The Toyota Camry is...Ch. 14 - One measure of the risk or volatility of an...Ch. 14 - As part of a study on transportation safety, the...Ch. 14 - Consumer Reports tested 166 different...Ch. 14 - When trying to decide what car to buy, real value...Ch. 14 - Buckeye Creek Amusement Park is open from the...
Knowledge Booster


Learn more about
Need a deep-dive on the concept behind this application? Look no further. Learn more about this topic, statistics and related others by exploring similar questions and additional content below.Similar questions
- 1. If a firm spends more on advertising, is it likely to increase sales? Data on annual sales (in $100,000s) and advertising expenditures (in $10,000s) were collected for 20 firms in order to estimate the model Sales = Po + B₁Advertising + ε. A portion of the regression results is shown in the accompanying table. Intercept Advertising Standard Coefficients Error t Stat p-value -7.42 1.46 -5.09 7.66E-05 0.42 0.05 8.70 7.26E-08 a. Interpret the estimated slope coefficient. b. What is the sample regression equation? C. Predict the sales for a firm that spends $500,000 annually on advertising.arrow_forwardCan you help me solve problem 38 with steps im stuck.arrow_forwardHow do the samples hold up to the efficiency test? What percentages of the samples pass or fail the test? What would be the likelihood of having the following specific number of efficiency test failures in the next 300 processors tested? 1 failures, 5 failures, 10 failures and 20 failures.arrow_forward
- The battery temperatures are a major concern for us. Can you analyze and describe the sample data? What are the average and median temperatures? How much variability is there in the temperatures? Is there anything that stands out? Our engineers’ assumption is that the temperature data is normally distributed. If that is the case, what would be the likelihood that the Safety Zone temperature will exceed 5.15 degrees? What is the probability that the Safety Zone temperature will be less than 4.65 degrees? What is the actual percentage of samples that exceed 5.25 degrees or are less than 4.75 degrees? Is the manufacturing process producing units with stable Safety Zone temperatures? Can you check if there are any apparent changes in the temperature pattern? Are there any outliers? A closer look at the Z-scores should help you in this regard.arrow_forwardNeed help pleasearrow_forwardPlease conduct a step by step of these statistical tests on separate sheets of Microsoft Excel. If the calculations in Microsoft Excel are incorrect, the null and alternative hypotheses, as well as the conclusions drawn from them, will be meaningless and will not receive any points. 4. One-Way ANOVA: Analyze the customer satisfaction scores across four different product categories to determine if there is a significant difference in means. (Hints: The null can be about maintaining status-quo or no difference among groups) H0 = H1=arrow_forward
- Please conduct a step by step of these statistical tests on separate sheets of Microsoft Excel. If the calculations in Microsoft Excel are incorrect, the null and alternative hypotheses, as well as the conclusions drawn from them, will be meaningless and will not receive any points 2. Two-Sample T-Test: Compare the average sales revenue of two different regions to determine if there is a significant difference. (Hints: The null can be about maintaining status-quo or no difference among groups; if alternative hypothesis is non-directional use the two-tailed p-value from excel file to make a decision about rejecting or not rejecting null) H0 = H1=arrow_forwardPlease conduct a step by step of these statistical tests on separate sheets of Microsoft Excel. If the calculations in Microsoft Excel are incorrect, the null and alternative hypotheses, as well as the conclusions drawn from them, will be meaningless and will not receive any points 3. Paired T-Test: A company implemented a training program to improve employee performance. To evaluate the effectiveness of the program, the company recorded the test scores of 25 employees before and after the training. Determine if the training program is effective in terms of scores of participants before and after the training. (Hints: The null can be about maintaining status-quo or no difference among groups; if alternative hypothesis is non-directional, use the two-tailed p-value from excel file to make a decision about rejecting or not rejecting the null) H0 = H1= Conclusion:arrow_forwardPlease conduct a step by step of these statistical tests on separate sheets of Microsoft Excel. If the calculations in Microsoft Excel are incorrect, the null and alternative hypotheses, as well as the conclusions drawn from them, will be meaningless and will not receive any points. The data for the following questions is provided in Microsoft Excel file on 4 separate sheets. Please conduct these statistical tests on separate sheets of Microsoft Excel. If the calculations in Microsoft Excel are incorrect, the null and alternative hypotheses, as well as the conclusions drawn from them, will be meaningless and will not receive any points. 1. One Sample T-Test: Determine whether the average satisfaction rating of customers for a product is significantly different from a hypothetical mean of 75. (Hints: The null can be about maintaining status-quo or no difference; If your alternative hypothesis is non-directional (e.g., μ≠75), you should use the two-tailed p-value from excel file to…arrow_forward
- Please conduct a step by step of these statistical tests on separate sheets of Microsoft Excel. If the calculations in Microsoft Excel are incorrect, the null and alternative hypotheses, as well as the conclusions drawn from them, will be meaningless and will not receive any points. 1. One Sample T-Test: Determine whether the average satisfaction rating of customers for a product is significantly different from a hypothetical mean of 75. (Hints: The null can be about maintaining status-quo or no difference; If your alternative hypothesis is non-directional (e.g., μ≠75), you should use the two-tailed p-value from excel file to make a decision about rejecting or not rejecting null. If alternative is directional (e.g., μ < 75), you should use the lower-tailed p-value. For alternative hypothesis μ > 75, you should use the upper-tailed p-value.) H0 = H1= Conclusion: The p value from one sample t-test is _______. Since the two-tailed p-value is _______ 2. Two-Sample T-Test:…arrow_forwardPlease conduct a step by step of these statistical tests on separate sheets of Microsoft Excel. If the calculations in Microsoft Excel are incorrect, the null and alternative hypotheses, as well as the conclusions drawn from them, will be meaningless and will not receive any points. What is one sample T-test? Give an example of business application of this test? What is Two-Sample T-Test. Give an example of business application of this test? .What is paired T-test. Give an example of business application of this test? What is one way ANOVA test. Give an example of business application of this test? 1. One Sample T-Test: Determine whether the average satisfaction rating of customers for a product is significantly different from a hypothetical mean of 75. (Hints: The null can be about maintaining status-quo or no difference; If your alternative hypothesis is non-directional (e.g., μ≠75), you should use the two-tailed p-value from excel file to make a decision about rejecting or not…arrow_forwardThe data for the following questions is provided in Microsoft Excel file on 4 separate sheets. Please conduct a step by step of these statistical tests on separate sheets of Microsoft Excel. If the calculations in Microsoft Excel are incorrect, the null and alternative hypotheses, as well as the conclusions drawn from them, will be meaningless and will not receive any points. What is one sample T-test? Give an example of business application of this test? What is Two-Sample T-Test. Give an example of business application of this test? .What is paired T-test. Give an example of business application of this test? What is one way ANOVA test. Give an example of business application of this test? 1. One Sample T-Test: Determine whether the average satisfaction rating of customers for a product is significantly different from a hypothetical mean of 75. (Hints: The null can be about maintaining status-quo or no difference; If your alternative hypothesis is non-directional (e.g., μ≠75), you…arrow_forward
arrow_back_ios
SEE MORE QUESTIONS
arrow_forward_ios
Recommended textbooks for you
 Functions and Change: A Modeling Approach to Coll...AlgebraISBN:9781337111348Author:Bruce Crauder, Benny Evans, Alan NoellPublisher:Cengage Learning
 Algebra and Trigonometry (MindTap Course List)AlgebraISBN:9781305071742Author:James Stewart, Lothar Redlin, Saleem WatsonPublisher:Cengage Learning
 College AlgebraAlgebraISBN:9781305115545Author:James Stewart, Lothar Redlin, Saleem WatsonPublisher:Cengage Learning
 Glencoe Algebra 1, Student Edition, 9780079039897...AlgebraISBN:9780079039897Author:CarterPublisher:McGraw Hill
 Big Ideas Math A Bridge To Success Algebra 1: Stu...AlgebraISBN:9781680331141Author:HOUGHTON MIFFLIN HARCOURTPublisher:Houghton Mifflin Harcourt
Functions and Change: A Modeling Approach to Coll...
Algebra
ISBN:9781337111348
Author:Bruce Crauder, Benny Evans, Alan Noell
Publisher:Cengage Learning
Algebra and Trigonometry (MindTap Course List)
Algebra
ISBN:9781305071742
Author:James Stewart, Lothar Redlin, Saleem Watson
Publisher:Cengage Learning
College Algebra
Algebra
ISBN:9781305115545
Author:James Stewart, Lothar Redlin, Saleem Watson
Publisher:Cengage Learning
Glencoe Algebra 1, Student Edition, 9780079039897...
Algebra
ISBN:9780079039897
Author:Carter
Publisher:McGraw Hill
Big Ideas Math A Bridge To Success Algebra 1: Stu...
Algebra
ISBN:9781680331141
Author:HOUGHTON MIFFLIN HARCOURT
Publisher:Houghton Mifflin Harcourt
Correlation Vs Regression: Difference Between them with definition & Comparison Chart; Author: Key Differences;https://www.youtube.com/watch?v=Ou2QGSJVd0U;License: Standard YouTube License, CC-BY
Correlation and Regression: Concepts with Illustrative examples; Author: LEARN & APPLY : Lean and Six Sigma;https://www.youtube.com/watch?v=xTpHD5WLuoA;License: Standard YouTube License, CC-BY