Thinking Like an Engineer: An Active Learning Approach (4th Edition)
4th Edition
ISBN: 9780134639673
Author: Elizabeth A. Stephan, David R. Bowman, William J. Park, Benjamin L. Sill, Matthew W. Ohland
Publisher: PEARSON
expand_more
expand_more
format_list_bulleted
Concept explainers
Textbook Question
Chapter 14.3, Problem 4CC
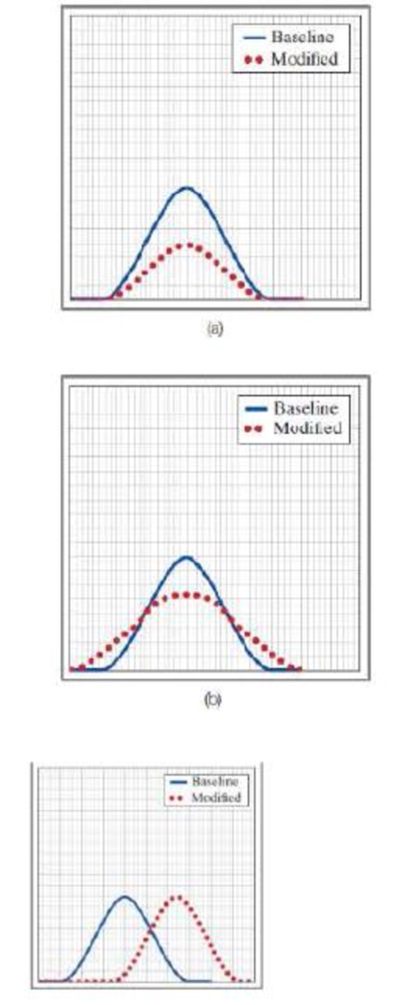
For each of the following graphs, decide if the mean, variance, or population size has changed.

Expert Solution & Answer
Want to see the full answer?
Check out a sample textbook solution
Students have asked these similar questions
3. Find a basis of eigenvectors and diagonalize.
4
0
-19
7
a.
b.
1-42
16
12-20
[21-61
2. Find the eigenvalues. Find the corresponding eigenvectors.
6
2
-21
[0 -3
1
3 31
a.
2 5
0
b.
3 0
-6
C.
1
1 0
-2 0
7
L6
6
0
1
1
2.
(Hint: λ =
= 3)
USE MATLAB ONLY
provide typed code
solve for velocity triangle and dont provide copied answer
Turbomachienery .
GIven:
vx = 185 m/s, flow angle = 60 degrees, (leaving a stator in axial flow) R = 0.5, U = 150 m/s, b2 = -a3, a2 = -b3
Find: velocity triangle , a. magnitude of abs vel leaving rotor (m/s) b. flow absolute angles (a1, a2, a3) 3. flow rel angles (b2, b3) d. specific work done e. use code to draw vel. diagram
Use this code for plot
% plots Velocity Tri. in Ch4
function plotveltri(al1,al2,al3,b2,b3)
S1L = [0 1];
V1x = [0 0];
V1s = [0 1*tand(al3)];
S2L = [2 3];
V2x = [0 0];
V2s = [0 1*tand(al2)];
W2s = [0 1*tand(b2)];
U2x = [3 3];
U2y = [1*tand(b2) 1*tand(al2)];
S3L = [4 5];
V3x = [0 0];
V3r = [0 1*tand(al3)];
W3r = [0 1*tand(b3)];
U3x = [5 5];
U3y = [1*tand(b3) 1*tand(al3)];
plot(S1L,V1x,'k',S1L,V1s,'r',...
S2L,V2x,'k',S2L,V2s,'r',S2L,W2s,'b',U2x,U2y,'g',...
S3L,V3x,'k',S3L,V3r,'r',S3L,W3r,'b',U3x,U3y,'g',......
'LineWidth',2,'MarkerSize',10),...…
Chapter 14 Solutions
Thinking Like an Engineer: An Active Learning Approach (4th Edition)
Ch. 14.1 - The following table lists the number of computer...Ch. 14.2 - For the following mass data g1ven in units of...Ch. 14.2 - For the following temperature data given in units...Ch. 14.3 - For each of the following graphs, decide if the...Ch. 14.3 - Use the scenario described in Example 14-4. For...Ch. 14.4 - Consider the weight of shipping boxes sent down an...Ch. 14.4 - Prob. 7CCCh. 14.5 - Prob. 8CCCh. 14 - For the following pressure data, recorded in units...Ch. 14 - A technician tested two temperature probes by...
Ch. 14 - One of the NAE Grand Challenges for Engineering is...Ch. 14 - You use the data from the Mauna Loa observatory in...Ch. 14 - Polyetheretherketone (PEEK)TM polymers are...Ch. 14 - A technician tested a temperature probe by...Ch. 14 - During November, the heading system in your...Ch. 14 - You are assigned to inspect metal-composite beam...Ch. 14 - Use the scenario described in the preceding...Ch. 14 - You test several temperature probes by inserting...Ch. 14 - Use the scenario described in the previous Problem...Ch. 14 - Prob. 14ICACh. 14 - The following data were collected from a...Ch. 14 - The following data were collected from a...Ch. 14 - The following table lists the number of resin...
Knowledge Booster
Learn more about
Need a deep-dive on the concept behind this application? Look no further. Learn more about this topic, mechanical-engineering and related others by exploring similar questions and additional content below.Similar questions
- USE MATLAB ONLY provide typed code solve for velocity triangle and dont provide copied answer Turbomachienery . GIven: vx = 185 m/s, flow angle = 60 degrees, R = 0.5, U = 150 m/s, b2 = -a3, a2 = -b3 Find: velocity triangle , a. magnitude of abs vel leaving rotor (m/s) b. flow absolute angles (a1, a2, a3) 3. flow rel angles (b2, b3) d. specific work done e. use code to draw vel. diagram Use this code for plot % plots Velocity Tri. in Ch4 function plotveltri(al1,al2,al3,b2,b3) S1L = [0 1]; V1x = [0 0]; V1s = [0 1*tand(al3)]; S2L = [2 3]; V2x = [0 0]; V2s = [0 1*tand(al2)]; W2s = [0 1*tand(b2)]; U2x = [3 3]; U2y = [1*tand(b2) 1*tand(al2)]; S3L = [4 5]; V3x = [0 0]; V3r = [0 1*tand(al3)]; W3r = [0 1*tand(b3)]; U3x = [5 5]; U3y = [1*tand(b3) 1*tand(al3)]; plot(S1L,V1x,'k',S1L,V1s,'r',... S2L,V2x,'k',S2L,V2s,'r',S2L,W2s,'b',U2x,U2y,'g',... S3L,V3x,'k',S3L,V3r,'r',S3L,W3r,'b',U3x,U3y,'g',...... 'LineWidth',2,'MarkerSize',10),... axis([-1 6 -4 4]), ...…arrow_forwardThe answer should equal to 1157. Please sent me the solution. Thank you!arrow_forwardBONUS: If the volume of the 8cm x 6.5cm x 6cm Block of Aluminum was 312cm3 before machining, find how much material was removed when the fixture below was machined. +2 2.00 cm 6.00 cm 2.50 cm 6.50 cm 1.00 cm 2.50 cm 11.00 cm 8.00 cm 30 CP 9411 FL.4) (m² 1157 Area of triangle = 1/2*B*H Area of circle = лR² Circumference of a circle = 2πR 6.00 cm 6.50 cm 1.50 cm Radius 1.50 cm 1.00 cmarrow_forward
- Consider a 5m by 5m wet concret patio with an average water film thickness of .2mm. Now wind at 50 km/h is blowing over the surface. If the air is at 1 atm, 15oC and 35 percent relative humidity, determine how long it will take for the patio to completely dry.arrow_forward70. Compute the number of cubic centimeters of iron required for the cast-iron plate shown. The plate is 3.50 centimeters thick. Round the answer to the nearest cubic centimeter. 50.0 cm 40.0 cm Radius 150° 115.0 cm- 81.0 cmarrow_forwardLaw of Sines Solve the following problems using the Law of Sin 7. Find side x. All dimensions are in inches. -°-67°-37° 81° x Sin A 8.820 X 67°00' 32°00' a sin A b C sin B sin Carrow_forward
- 35. a. Determine B. b. Determine side b. c. Determine side c. 5.330 in.- ZB 73°30'arrow_forwardConsider a 12 cm internal diameter, 14 m long circular duct whose interior surface is wet. The duct is to be dried by forcing dry air at 1 atm and 15 degrees C throught it at an average velocity of 3m/s. The duct passes through a chilled roo, and it remains at an average temp of 15 degrees C at all time. Determine the mass transfer coeeficient in the duct.arrow_forwardnote n=number of link(dont include the ground link (fixed))arrow_forward
arrow_back_ios
SEE MORE QUESTIONS
arrow_forward_ios
Recommended textbooks for you
 Elements Of ElectromagneticsMechanical EngineeringISBN:9780190698614Author:Sadiku, Matthew N. O.Publisher:Oxford University Press
 Mechanics of Materials (10th Edition)Mechanical EngineeringISBN:9780134319650Author:Russell C. HibbelerPublisher:PEARSON
 Thermodynamics: An Engineering ApproachMechanical EngineeringISBN:9781259822674Author:Yunus A. Cengel Dr., Michael A. BolesPublisher:McGraw-Hill Education
 Control Systems EngineeringMechanical EngineeringISBN:9781118170519Author:Norman S. NisePublisher:WILEY
 Mechanics of Materials (MindTap Course List)Mechanical EngineeringISBN:9781337093347Author:Barry J. Goodno, James M. GerePublisher:Cengage Learning
 Engineering Mechanics: StaticsMechanical EngineeringISBN:9781118807330Author:James L. Meriam, L. G. Kraige, J. N. BoltonPublisher:WILEY

Elements Of Electromagnetics
Mechanical Engineering
ISBN:9780190698614
Author:Sadiku, Matthew N. O.
Publisher:Oxford University Press

Mechanics of Materials (10th Edition)
Mechanical Engineering
ISBN:9780134319650
Author:Russell C. Hibbeler
Publisher:PEARSON

Thermodynamics: An Engineering Approach
Mechanical Engineering
ISBN:9781259822674
Author:Yunus A. Cengel Dr., Michael A. Boles
Publisher:McGraw-Hill Education

Control Systems Engineering
Mechanical Engineering
ISBN:9781118170519
Author:Norman S. Nise
Publisher:WILEY

Mechanics of Materials (MindTap Course List)
Mechanical Engineering
ISBN:9781337093347
Author:Barry J. Goodno, James M. Gere
Publisher:Cengage Learning

Engineering Mechanics: Statics
Mechanical Engineering
ISBN:9781118807330
Author:James L. Meriam, L. G. Kraige, J. N. Bolton
Publisher:WILEY
What is Metrology in Mechanical Engineering? | Terminologies & Measurement; Author: GaugeHow;https://www.youtube.com/watch?v=_KhMhFRehy8;License: Standard YouTube License, CC-BY