
Concept explainers
Videos
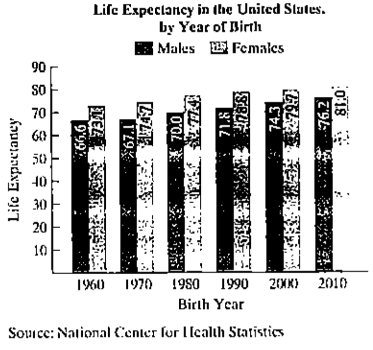
The bar graph gives the life- expectancy for American men and women born in six selected years. In Exercises 89-90, you will use the data to obtain models for life expectancy and make predictions about how long American men and women will live in the future
 .
.
Use the data for females shown in the bar graph at the bottom of the previous column to solve this exercise.
a. Let x represent the number of birth years after 1960 and let y represent female life expectancy. Create a
b. Draw a line through the two points that show female life expectancies for 1970 and 2000. Use the coordinates of these points to write a linear function that models life expectancy, E (x ), for American women born x years after 1960. Round the slope to two decimal places.
c. Use the function from part (b) to project the life expectancy of American women born in 2020.
Want to see the full answer?
Check out a sample textbook solution
Chapter 1 Solutions
PRECALCULUS CUSTOM W/MYMTHLAB >IC<


- (10) (16 points) Let R>0. Consider the truncated sphere S given as x² + y² + (z = √15R)² = R², z ≥0. where F(x, y, z) = −yi + xj . (a) (8 points) Consider the vector field V (x, y, z) = (▼ × F)(x, y, z) Think of S as a hot-air balloon where the vector field V is the velocity vector field measuring the hot gasses escaping through the porous surface S. The flux of V across S gives the volume flow rate of the gasses through S. Calculate this flux. Hint: Parametrize the boundary OS. Then use Stokes' Theorem. (b) (8 points) Calculate the surface area of the balloon. To calculate the surface area, do the following: Translate the balloon surface S by the vector (-15)k. The translated surface, call it S+ is part of the sphere x² + y²+z² = R². Why do S and S+ have the same area? ⚫ Calculate the area of S+. What is the natural spherical parametrization of S+?arrow_forward(1) (8 points) Let c(t) = (et, et sint, et cost). Reparametrize c as a unit speed curve starting from the point (1,0,1).arrow_forward(9) (16 points) Let F(x, y, z) = (x² + y − 4)i + 3xyj + (2x2 +z²)k = - = (x²+y4,3xy, 2x2 + 2²). (a) (4 points) Calculate the divergence and curl of F. (b) (6 points) Find the flux of V x F across the surface S given by x² + y²+2² = 16, z ≥ 0. (c) (6 points) Find the flux of F across the boundary of the unit cube E = [0,1] × [0,1] x [0,1].arrow_forward
- (8) (12 points) (a) (8 points) Let C be the circle x² + y² = 4. Let F(x, y) = (2y + e²)i + (x + sin(y²))j. Evaluate the line integral JF. F.ds. Hint: First calculate V x F. (b) (4 points) Let S be the surface r² + y² + z² = 4, z ≤0. Calculate the flux integral √(V × F) F).dS. Justify your answer.arrow_forwardDetermine whether the Law of Sines or the Law of Cosines can be used to find another measure of the triangle. a = 13, b = 15, C = 68° Law of Sines Law of Cosines Then solve the triangle. (Round your answers to four decimal places.) C = 15.7449 A = 49.9288 B = 62.0712 × Need Help? Read It Watch Itarrow_forward(4) (10 points) Evaluate √(x² + y² + z²)¹⁄² exp[}(x² + y² + z²)²] dV where D is the region defined by 1< x² + y²+ z² ≤4 and √√3(x² + y²) ≤ z. Note: exp(x² + y²+ 2²)²] means el (x²+ y²+=²)²]¸arrow_forward
- (2) (12 points) Let f(x,y) = x²e¯. (a) (4 points) Calculate Vf. (b) (4 points) Given x directional derivative 0, find the line of vectors u = D₁f(x, y) = 0. (u1, 2) such that the - (c) (4 points) Let u= (1+3√3). Show that Duƒ(1, 0) = ¦|▼ƒ(1,0)| . What is the angle between Vf(1,0) and the vector u? Explain.arrow_forwardFind the missing values by solving the parallelogram shown in the figure. (The lengths of the diagonals are given by c and d. Round your answers to two decimal places.) a b 29 39 66.50 C 17.40 d 0 54.0 126° a Ꮎ b darrow_forward(5) (10 points) Let D be the parallelogram in the xy-plane with vertices (0, 0), (1, 1), (1, 1), (0, -2). Let f(x,y) = xy/2. Use the linear change of variables T(u, v)=(u,u2v) = (x, y) 1 to calculate the integral f(x,y) dA= 0 ↓ The domain of T is a rectangle R. What is R? |ǝ(x, y) du dv. |ð(u, v)|arrow_forward
- 2 Anot ined sove in peaper PV+96252 Q3// Find the volume of the region between the cylinder z = y2 and the xy- plane that is bounded by the planes x=1, x=2,y=-2,andy=2. vertical rect a Q4// Draw and Evaluate Soxy-2sin (ny2)dydx D Lake tarrow_forwardDetermine whether the Law of Sines or the Law of Cosines can be used to find another measure of the triangle. B 13 cm 97° Law of Sines Law of Cosines A 43° Then solve the triangle. (Round your answers to two decimal places.) b = x C = A = 40.00arrow_forwardFind the missing values by solving the parallelogram shown in the figure. (The lengths of the diagonals are given by c and d. Round your answers to two decimal places.) a 29 b 39 d Ꮎ 126° a Ꮎ b darrow_forward
 Glencoe Algebra 1, Student Edition, 9780079039897...AlgebraISBN:9780079039897Author:CarterPublisher:McGraw Hill
 Holt Mcdougal Larson Pre-algebra: Student Edition...AlgebraISBN:9780547587776Author:HOLT MCDOUGALPublisher:HOLT MCDOUGAL
 Big Ideas Math A Bridge To Success Algebra 1: Stu...AlgebraISBN:9781680331141Author:HOUGHTON MIFFLIN HARCOURTPublisher:Houghton Mifflin Harcourt
 Trigonometry (MindTap Course List)TrigonometryISBN:9781337278461Author:Ron LarsonPublisher:Cengage Learning
