Explanation: Given The wave function for the electron in one dimensional system is, Ψ ( x ) = sin x The probability density curve for the function Ψ 2 ( x ) = sin 2 x contains all the positive values of the given function over the whole range. Therefore, the probability density curve for the given function is, Figure 1 (b) Explanation: Given The wave function for the electron in one dimensional system is, Ψ ( x ) = sin x The probability of finding electron for the given function is maximum on the values of x where the probability density curve has the maximum value. For the given function the value of sin x is maximum at the values x = π 2 and x = 3 π 2 . Therefore, the probability density curve for the given function has a peak at these values of x where probability of finding an electron is maximum. (c) Explanation: The wave function for the electron in one dimensional system is, Ψ ( x ) = sin x The probability of finding electron for the given function is minimum on the values of x where the probability density curve has the minimum value. For the given function the value of sin x is zero at the value of x = π . Therefore, the probability density curve for the given function has a node at this value of x where probability of finding electron is nil. Conclusion: (a) The probability density curve for the given function is as follows: (b) The values of x is maximum at x = π 2 and x = 3 π 2 . (c) The probability of finding an electron at x = π is zero and this point is called node.
Explanation: Given The wave function for the electron in one dimensional system is, Ψ ( x ) = sin x The probability density curve for the function Ψ 2 ( x ) = sin 2 x contains all the positive values of the given function over the whole range. Therefore, the probability density curve for the given function is, Figure 1 (b) Explanation: Given The wave function for the electron in one dimensional system is, Ψ ( x ) = sin x The probability of finding electron for the given function is maximum on the values of x where the probability density curve has the maximum value. For the given function the value of sin x is maximum at the values x = π 2 and x = 3 π 2 . Therefore, the probability density curve for the given function has a peak at these values of x where probability of finding an electron is maximum. (c) Explanation: The wave function for the electron in one dimensional system is, Ψ ( x ) = sin x The probability of finding electron for the given function is minimum on the values of x where the probability density curve has the minimum value. For the given function the value of sin x is zero at the value of x = π . Therefore, the probability density curve for the given function has a node at this value of x where probability of finding electron is nil. Conclusion: (a) The probability density curve for the given function is as follows: (b) The values of x is maximum at x = π 2 and x = 3 π 2 . (c) The probability of finding an electron at x = π is zero and this point is called node.
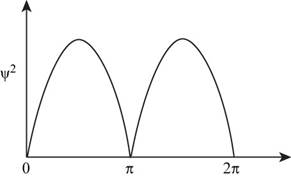
Given The wave function for the electron in one dimensional system is,
Ψ(x)=sinx
The probability density curve for the function Ψ2(x)=sin2x contains all the positive values of the given function over the whole range. Therefore, the probability density curve for the given function is,
Figure 1
(b)
Explanation:
Given The wave function for the electron in one dimensional system is,
Ψ(x)=sinx
The probability of finding electron for the given function is maximum on the values of x where the probability density curve has the maximum value. For the given function the value of sinx is maximum at the values x=π2 and x=3π2 . Therefore, the probability density curve for the given function has a peak at these values of x where probability of finding an electron is maximum.
(c)
Explanation: The wave function for the electron in one dimensional system is,
Ψ(x)=sinx
The probability of finding electron for the given function is minimum on the values of x where the probability density curve has the minimum value. For the given function the value of sinx is zero at the value of x=π . Therefore, the probability density curve for the given function has a node at this value of x where probability of finding electron is nil.
Conclusion:
(a) The probability density curve for the given function is as follows:
(b) The values of x is maximum at x=π2 and x=3π2 . (c) The probability of finding an electron at x=π is zero and this point is called node.
Need a deep-dive on the concept behind this application? Look no further. Learn more about this topic, chemistry and related others by exploring similar questions and additional content below.
The Bohr Model of the atom and Atomic Emission Spectra: Atomic Structure tutorial | Crash Chemistry; Author: Crash Chemistry Academy;https://www.youtube.com/watch?v=apuWi_Fbtys;License: Standard YouTube License, CC-BY


 ChemistryChemistryISBN:9781305957404Author:Steven S. Zumdahl, Susan A. Zumdahl, Donald J. DeCostePublisher:Cengage Learning
 ChemistryChemistryISBN:9781259911156Author:Raymond Chang Dr., Jason Overby ProfessorPublisher:McGraw-Hill Education
 Principles of Instrumental AnalysisChemistryISBN:9781305577213Author:Douglas A. Skoog, F. James Holler, Stanley R. CrouchPublisher:Cengage Learning
 Organic ChemistryChemistryISBN:9780078021558Author:Janice Gorzynski Smith Dr.Publisher:McGraw-Hill Education
 Chemistry: Principles and ReactionsChemistryISBN:9781305079373Author:William L. Masterton, Cecile N. HurleyPublisher:Cengage Learning
 Elementary Principles of Chemical Processes, Bind...ChemistryISBN:9781118431221Author:Richard M. Felder, Ronald W. Rousseau, Lisa G. BullardPublisher:WILEY