
Gen Combo Ll Statistical Techniques In Business And Economics; Connect Ac
17th Edition
ISBN: 9781260149623
Author: Lind
Publisher: MCG
expand_more
expand_more
format_list_bulleted
Concept explainers
Videos
Textbook Question
Chapter 14, Problem 7E
Given the following regression output,
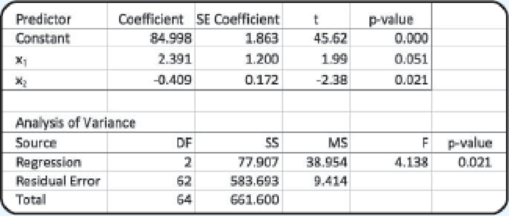
answer the following questions:
- a. Write the regression equation.
- b. If x1 is 4 and x2 is 11, what is the expected or predicted value of the dependent variable?
- c. How large is the sample? How many independent variables are there?
- d. Conduct a global test of hypothesis to see if any of the set of regression coefficients could be different from 0. Use the .05 significance level. What is your conclusion?
- e. Conduct a test of hypothesis for each independent variable. Use the .05 significance level. Which variable would you consider eliminating?
- f. Outline a strategy for deleting independent variables in this case.
Expert Solution & Answer
Want to see the full answer?
Check out a sample textbook solution
Students have asked these similar questions
Show all work
Show all work
Show all work
Chapter 14 Solutions
Gen Combo Ll Statistical Techniques In Business And Economics; Connect Ac
Ch. 14 - There are many restaurants in northeastern South...Ch. 14 - The director of marketing at Reeves Wholesale...Ch. 14 - Thompson Photo Works purchased several new, highly...Ch. 14 - A consulting group was hired by the Human...Ch. 14 - Cellulon, a manufacturer of home insulation, wants...Ch. 14 - Refer to Self-Review 141 on the subject of...Ch. 14 - Prob. 5ECh. 14 - Prob. 6ECh. 14 - Prob. 3SRCh. 14 - Given the following regression output, answer the...
Ch. 14 - The following regression output was obtained from...Ch. 14 - A study by the American Realtors Association...Ch. 14 - The manager of High Point Sofa and Chair, a large...Ch. 14 - Prob. 10ECh. 14 - Prob. 11ECh. 14 - A real estate developer wishes to study the...Ch. 14 - Prob. 13CECh. 14 - Prob. 14CECh. 14 - Prob. 15CECh. 14 - Prob. 16CECh. 14 - The district manager of Jasons, a large discount...Ch. 14 - Suppose that the sales manager of a large...Ch. 14 - The administrator of a new paralegal program at...Ch. 14 - Prob. 20CECh. 14 - Prob. 21CECh. 14 - A regional planner is studying the demographics of...Ch. 14 - Great Plains Distributors, Inc. sells roofing and...Ch. 14 - Prob. 24CECh. 14 - Prob. 25CECh. 14 - Prob. 26CECh. 14 - An investment advisor is studying the relationship...Ch. 14 - Prob. 28CECh. 14 - Prob. 29CECh. 14 - The director of special events for Sun City...Ch. 14 - Prob. 31CECh. 14 - Prob. 32CECh. 14 - Prob. 33DACh. 14 - Prob. 34DACh. 14 - Prob. 35DACh. 14 - Prob. 1PCh. 14 - Quick-print firms in a large downtown business...Ch. 14 - The following ANOVA output is given. a. Compute...Ch. 14 - Prob. 1CCh. 14 - Prob. 2CCh. 14 - Prob. 3CCh. 14 - In a scatter diagram, the dependent variable is...Ch. 14 - What level of measurement is required to compute...Ch. 14 - If there is no correlation between two variables,...Ch. 14 - Which of the following values indicates the...Ch. 14 - Under what conditions will the coefficient of...Ch. 14 - Given the following regression equation, = 7 ...Ch. 14 - Given the following regression equation, = 7 ...Ch. 14 - Given the following regression equation, = 7 ...Ch. 14 - Prob. 1.9PTCh. 14 - In a multiple regression equation, what is the...Ch. 14 - Prob. 1.11PTCh. 14 - Prob. 1.12PTCh. 14 - For a dummy variable, such as gender, how many...Ch. 14 - What is the term given to a table that shows all...Ch. 14 - If there is a linear relationship between the...Ch. 14 - Given the following regression analysis output: a....Ch. 14 - Given the following regression analysis output. a....
Knowledge Booster


Learn more about
Need a deep-dive on the concept behind this application? Look no further. Learn more about this topic, statistics and related others by exploring similar questions and additional content below.Similar questions
- A marketing agency wants to determine whether different advertising platforms generate significantly different levels of customer engagement. The agency measures the average number of daily clicks on ads for three platforms: Social Media, Search Engines, and Email Campaigns. The agency collects data on daily clicks for each platform over a 10-day period and wants to test whether there is a statistically significant difference in the mean number of daily clicks among these platforms. Conduct ANOVA test. You can provide your answer by inserting a text box and the answer must include: also please provide a step by on getting the answers in excel Null hypothesis, Alternative hypothesis, Show answer (output table/summary table), and Conclusion based on the P value.arrow_forwardA company found that the daily sales revenue of its flagship product follows a normal distribution with a mean of $4500 and a standard deviation of $450. The company defines a "high-sales day" that is, any day with sales exceeding $4800. please provide a step by step on how to get the answers Q: What percentage of days can the company expect to have "high-sales days" or sales greater than $4800? Q: What is the sales revenue threshold for the bottom 10% of days? (please note that 10% refers to the probability/area under bell curve towards the lower tail of bell curve) Provide answers in the yellow cellsarrow_forwardBusiness Discussarrow_forward
- The following data represent total ventilation measured in liters of air per minute per square meter of body area for two independent (and randomly chosen) samples. Analyze these data using the appropriate non-parametric hypothesis testarrow_forwardeach column represents before & after measurements on the same individual. Analyze with the appropriate non-parametric hypothesis test for a paired design.arrow_forwardShould you be confident in applying your regression equation to estimate the heart rate of a python at 35°C? Why or why not?arrow_forward
arrow_back_ios
SEE MORE QUESTIONS
arrow_forward_ios
Recommended textbooks for you
 Functions and Change: A Modeling Approach to Coll...AlgebraISBN:9781337111348Author:Bruce Crauder, Benny Evans, Alan NoellPublisher:Cengage Learning
 Glencoe Algebra 1, Student Edition, 9780079039897...AlgebraISBN:9780079039897Author:CarterPublisher:McGraw Hill
 Big Ideas Math A Bridge To Success Algebra 1: Stu...AlgebraISBN:9781680331141Author:HOUGHTON MIFFLIN HARCOURTPublisher:Houghton Mifflin Harcourt
 Holt Mcdougal Larson Pre-algebra: Student Edition...AlgebraISBN:9780547587776Author:HOLT MCDOUGALPublisher:HOLT MCDOUGAL
Functions and Change: A Modeling Approach to Coll...
Algebra
ISBN:9781337111348
Author:Bruce Crauder, Benny Evans, Alan Noell
Publisher:Cengage Learning
Glencoe Algebra 1, Student Edition, 9780079039897...
Algebra
ISBN:9780079039897
Author:Carter
Publisher:McGraw Hill
Big Ideas Math A Bridge To Success Algebra 1: Stu...
Algebra
ISBN:9781680331141
Author:HOUGHTON MIFFLIN HARCOURT
Publisher:Houghton Mifflin Harcourt
Holt Mcdougal Larson Pre-algebra: Student Edition...
Algebra
ISBN:9780547587776
Author:HOLT MCDOUGAL
Publisher:HOLT MCDOUGAL
Correlation Vs Regression: Difference Between them with definition & Comparison Chart; Author: Key Differences;https://www.youtube.com/watch?v=Ou2QGSJVd0U;License: Standard YouTube License, CC-BY
Correlation and Regression: Concepts with Illustrative examples; Author: LEARN & APPLY : Lean and Six Sigma;https://www.youtube.com/watch?v=xTpHD5WLuoA;License: Standard YouTube License, CC-BY